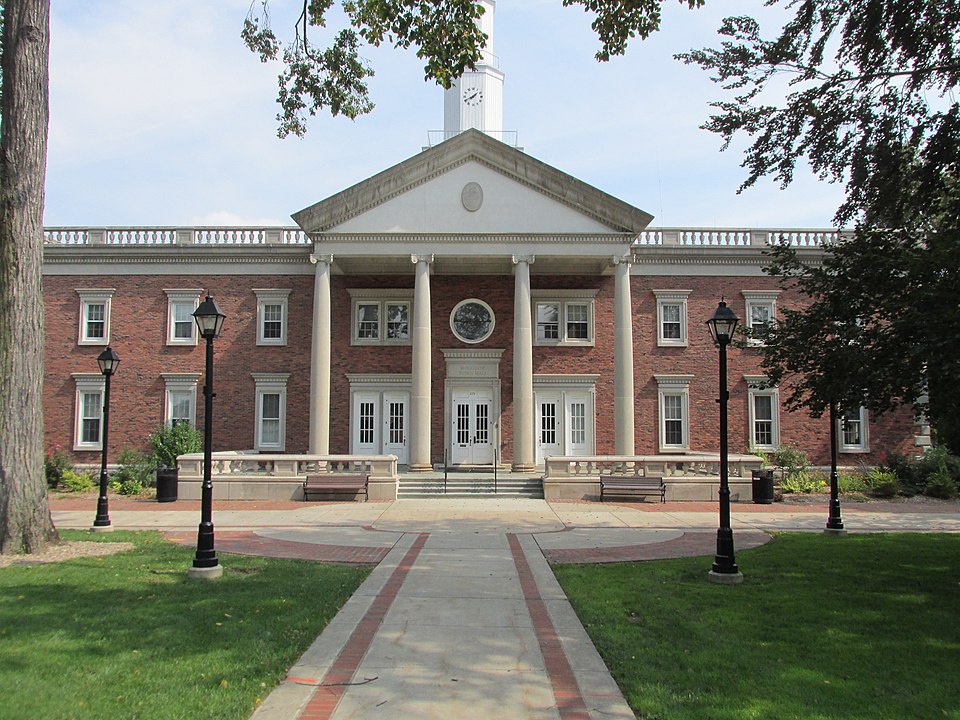
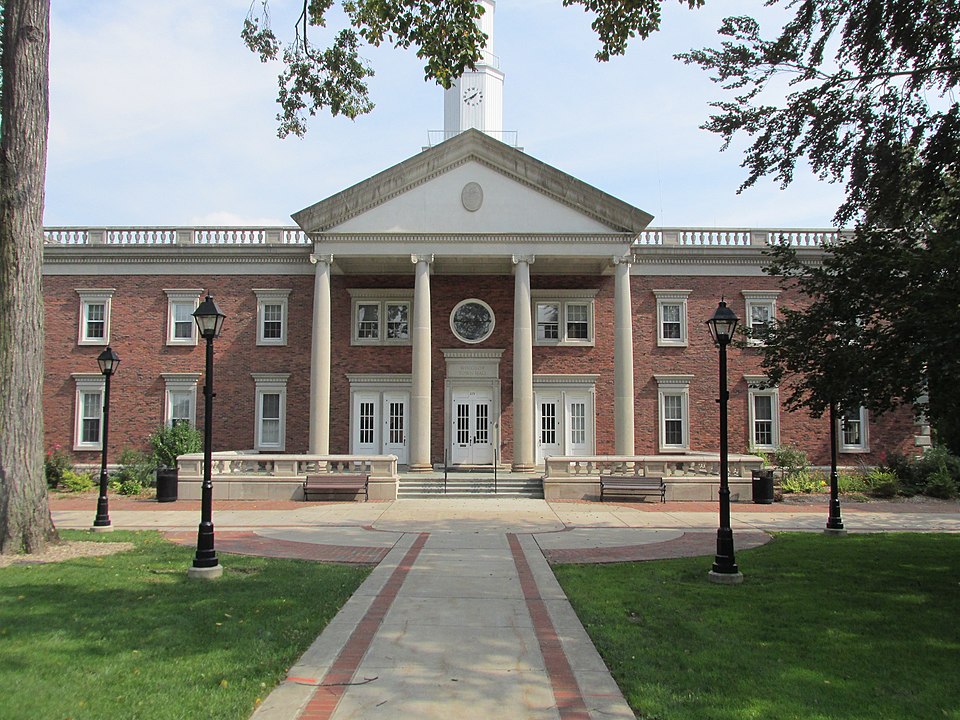
Windsor, CT
By July 7, 2025, Windsor had a complete, data-driven picture of pavement conditions across 156 miles, delivered in weeks instead of months.

Windsor, CT Infrastructure Assessment
Summary
- 156 roadway miles scanned and scored in weeks, with delivery by July 7, 2025, accelerating visible repairs for residents
- Detailed, actionable pavement condition data enabled Windsor to create a defensible, data-driven paving plan faster
- Clear priorities and accurate budgets focused taxpayer dollars where they matter most and reduced friction in public meetings
Problem
Windsor’s mix of arterials and neighborhood streets faced heavy wear from New England freeze–thaw cycles, but staff lacked the credible, current street-level data needed to direct repairs where they would do the most good. Without accurate paving budgets and a clear prioritization method, the team was often reactive to complaints and appeared to make decisions street by street instead of following a comprehensive plan. This made it hard to justify actions in town meetings and slowed the pace of improvements that residents expected.
Solution
Windsor selected Cyvl to survey every public roadway using vehicle-mounted LiDAR and sensors, capturing high-resolution, consistent data across the entire network. Cyvl’s Infrastructure Intelligence platform used AI to translate those scans into objective condition scores, segment-level inventories, and costed, prioritized repair lists tailored to Windsor’s policies and funding. The result was detailed, actionable pavement condition data for 156 roadway miles and a defensible, easy-to-communicate plan that empowered leaders to make better decisions and move to construction faster.
Impact
By July 7, 2025, Windsor had a complete, data-driven picture of pavement conditions across 156 miles, delivered in weeks instead of months. Using the Infrastructure Intelligence platform, staff turned objective condition scores into a transparent, prioritized program with clear cost ranges and schedules. This speed shortened the time from data to action, so residents saw smoother travel and safer streets sooner in the next construction window.
- Detailed, actionable pavement condition data for 156 roadway miles gave engineers block-by-block clarity to target repairs residents notice first
- Weeks-not-months delivery by July 7, 2025 shortened the planning cycle and moved crews to the field faster
- Prioritized repair lists and segment-level scores made town meetings smoother by showing why each street is scheduled when it is
- A defensible paving plan with accurate budget ranges helped secure funding and demonstrate efficient use of taxpayer dollars
- Clear sequencing and work windows improved crew scheduling, reducing repeat mobilizations and neighborhood disruption
- Data-backed responses reduced 311 volume and shifted staff time from inbox management to field work
- Proactive maintenance guided by objective scores reduced pothole formation and improved safety for drivers, cyclists, and pedestrians


-%20logo%20(unpadded).png.png)