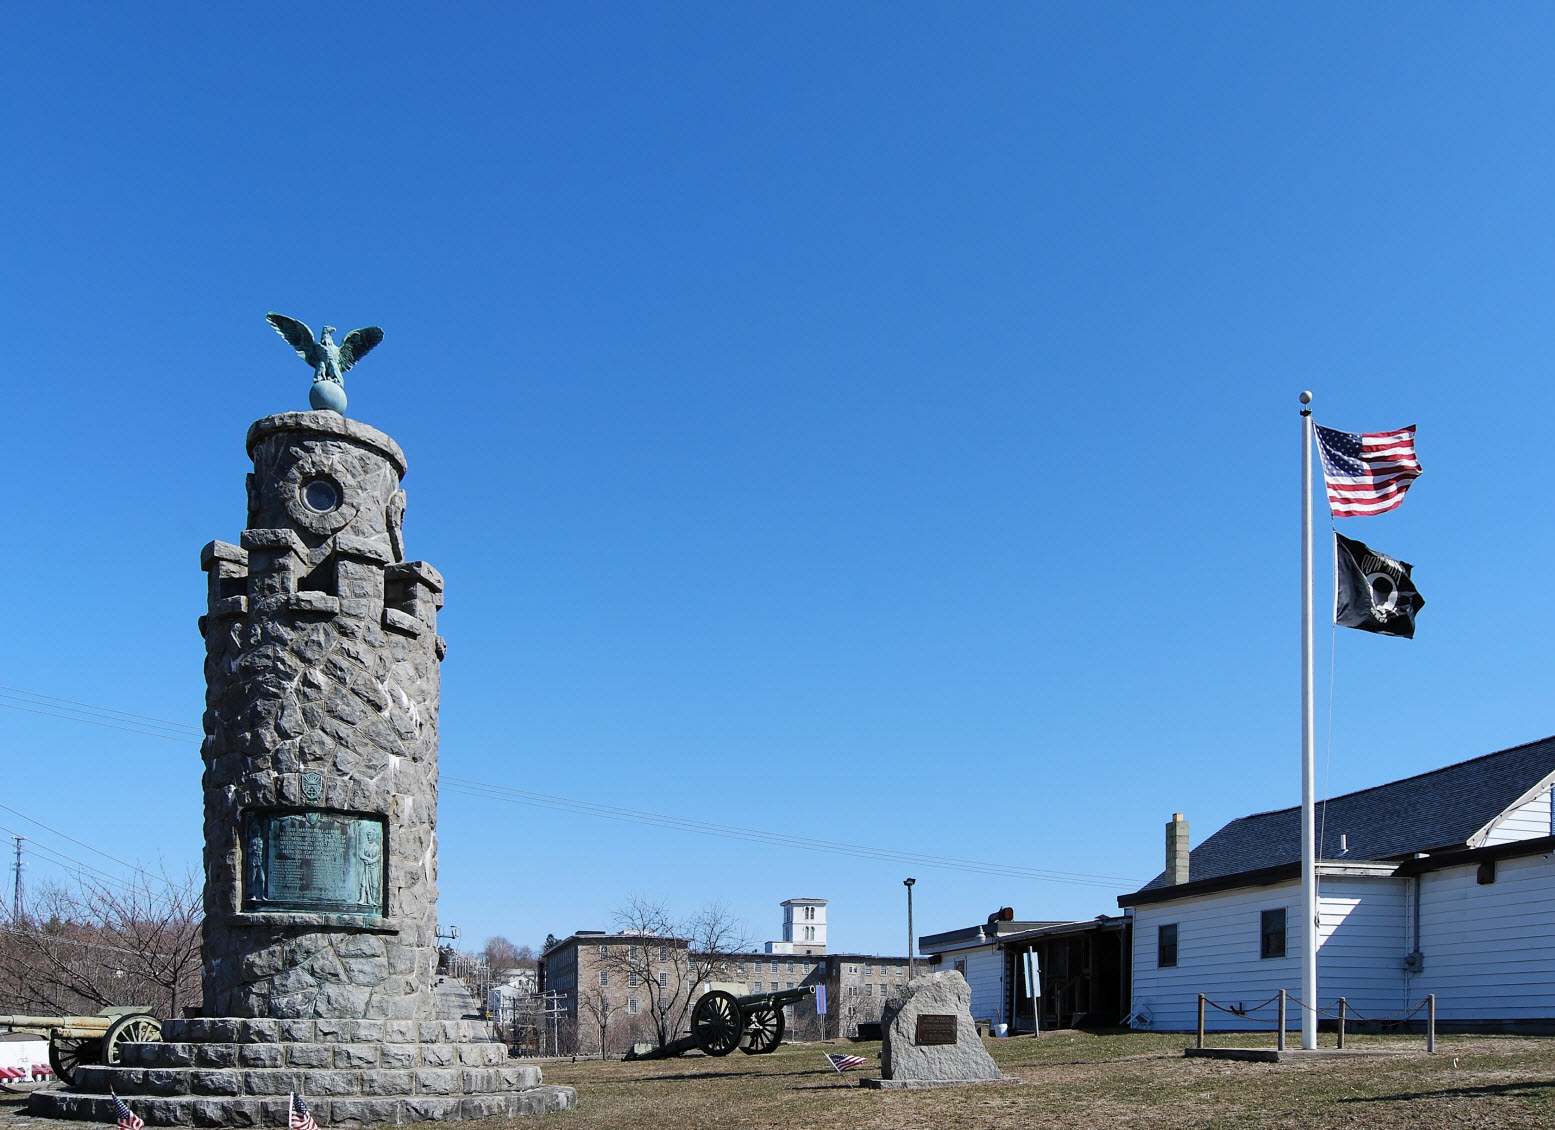
West Warwick, RI
By January, 10, 2023, West Warwick received a complete, data-rich snapshot of its streets—months faster than traditional methods—allowing work to be scheduled for the upcoming construction window.

West Warwick, RI Infrastructure Assessment
Summary
- 55 roadway miles surveyed and scored in weeks, not months, accelerating visible street repairs for residents
- Clear, defensible paving plan improved safety and transparency, so neighbors understand when their road is scheduled
- Efficient budgeting and work scheduling boosted confidence at town meetings and reduced complaint volume
Problem
Before 2023, West Warwick relied on outdated or inconsistent pavement data, making it hard to know which roads to fix or when, and leaving budgets based on estimates rather than facts. Staff often found themselves reactive to complaints with no clear prioritization method, and struggled to answer the recurring question, “Why not my road?” Leaders faced pressure at town meetings and had difficulty defending funding requests because they lacked trustworthy, network-wide information.
Solution
To change that trajectory, West Warwick selected Cyvl to rapidly scan the entire network using vehicle-mounted LiDAR and sensors, covering 55 roadway miles with high-fidelity condition measurements. Within weeks, Cyvl’s Infrastructure Intelligence platform used AI to convert the raw survey into network-level condition scores, mapped distresses, and prioritized repair lists supported by easy-to-share reports and GIS layers. The city gained detailed, actionable pavement condition data and a defensible plan that aligned maintenance, preservation, and rehabilitation decisions with community needs.
Impact
By January, 10, 2023, West Warwick received a complete, data-rich snapshot of its streets—months faster than traditional methods—allowing work to be scheduled for the upcoming construction window. With objective condition scores across 55 miles, the team moved from reactive to proactive, directing crews to the highest-need segments first and explaining decisions clearly to residents. The data made budget allocation, public communication, and seasonal scheduling straightforward, translating into faster fixes residents could see and safer daily travel.
- 55 roadway miles scanned and scored, delivered by January, 10, 2023, so projects could move from data to design and bids in weeks
- Faster pothole and patch response because crews had a prioritized, block-by-block worklist backed by objective data
- Town meetings run smoother with clear maps and reports that answer “Why not my road?” and show when each street is planned
- Budget requests are easier to defend, demonstrating efficient use of taxpayer dollars and unlocking more funding for visible repairs
- Scheduling is streamlined—crews, contractors, and materials are lined up earlier, shortening the time between survey and construction


-%20logo%20(unpadded).png.png)