Watertown, CT
By September 23, 2022, Watertown had a complete, town‑wide street and sign dataset that turned uncertainty into action.
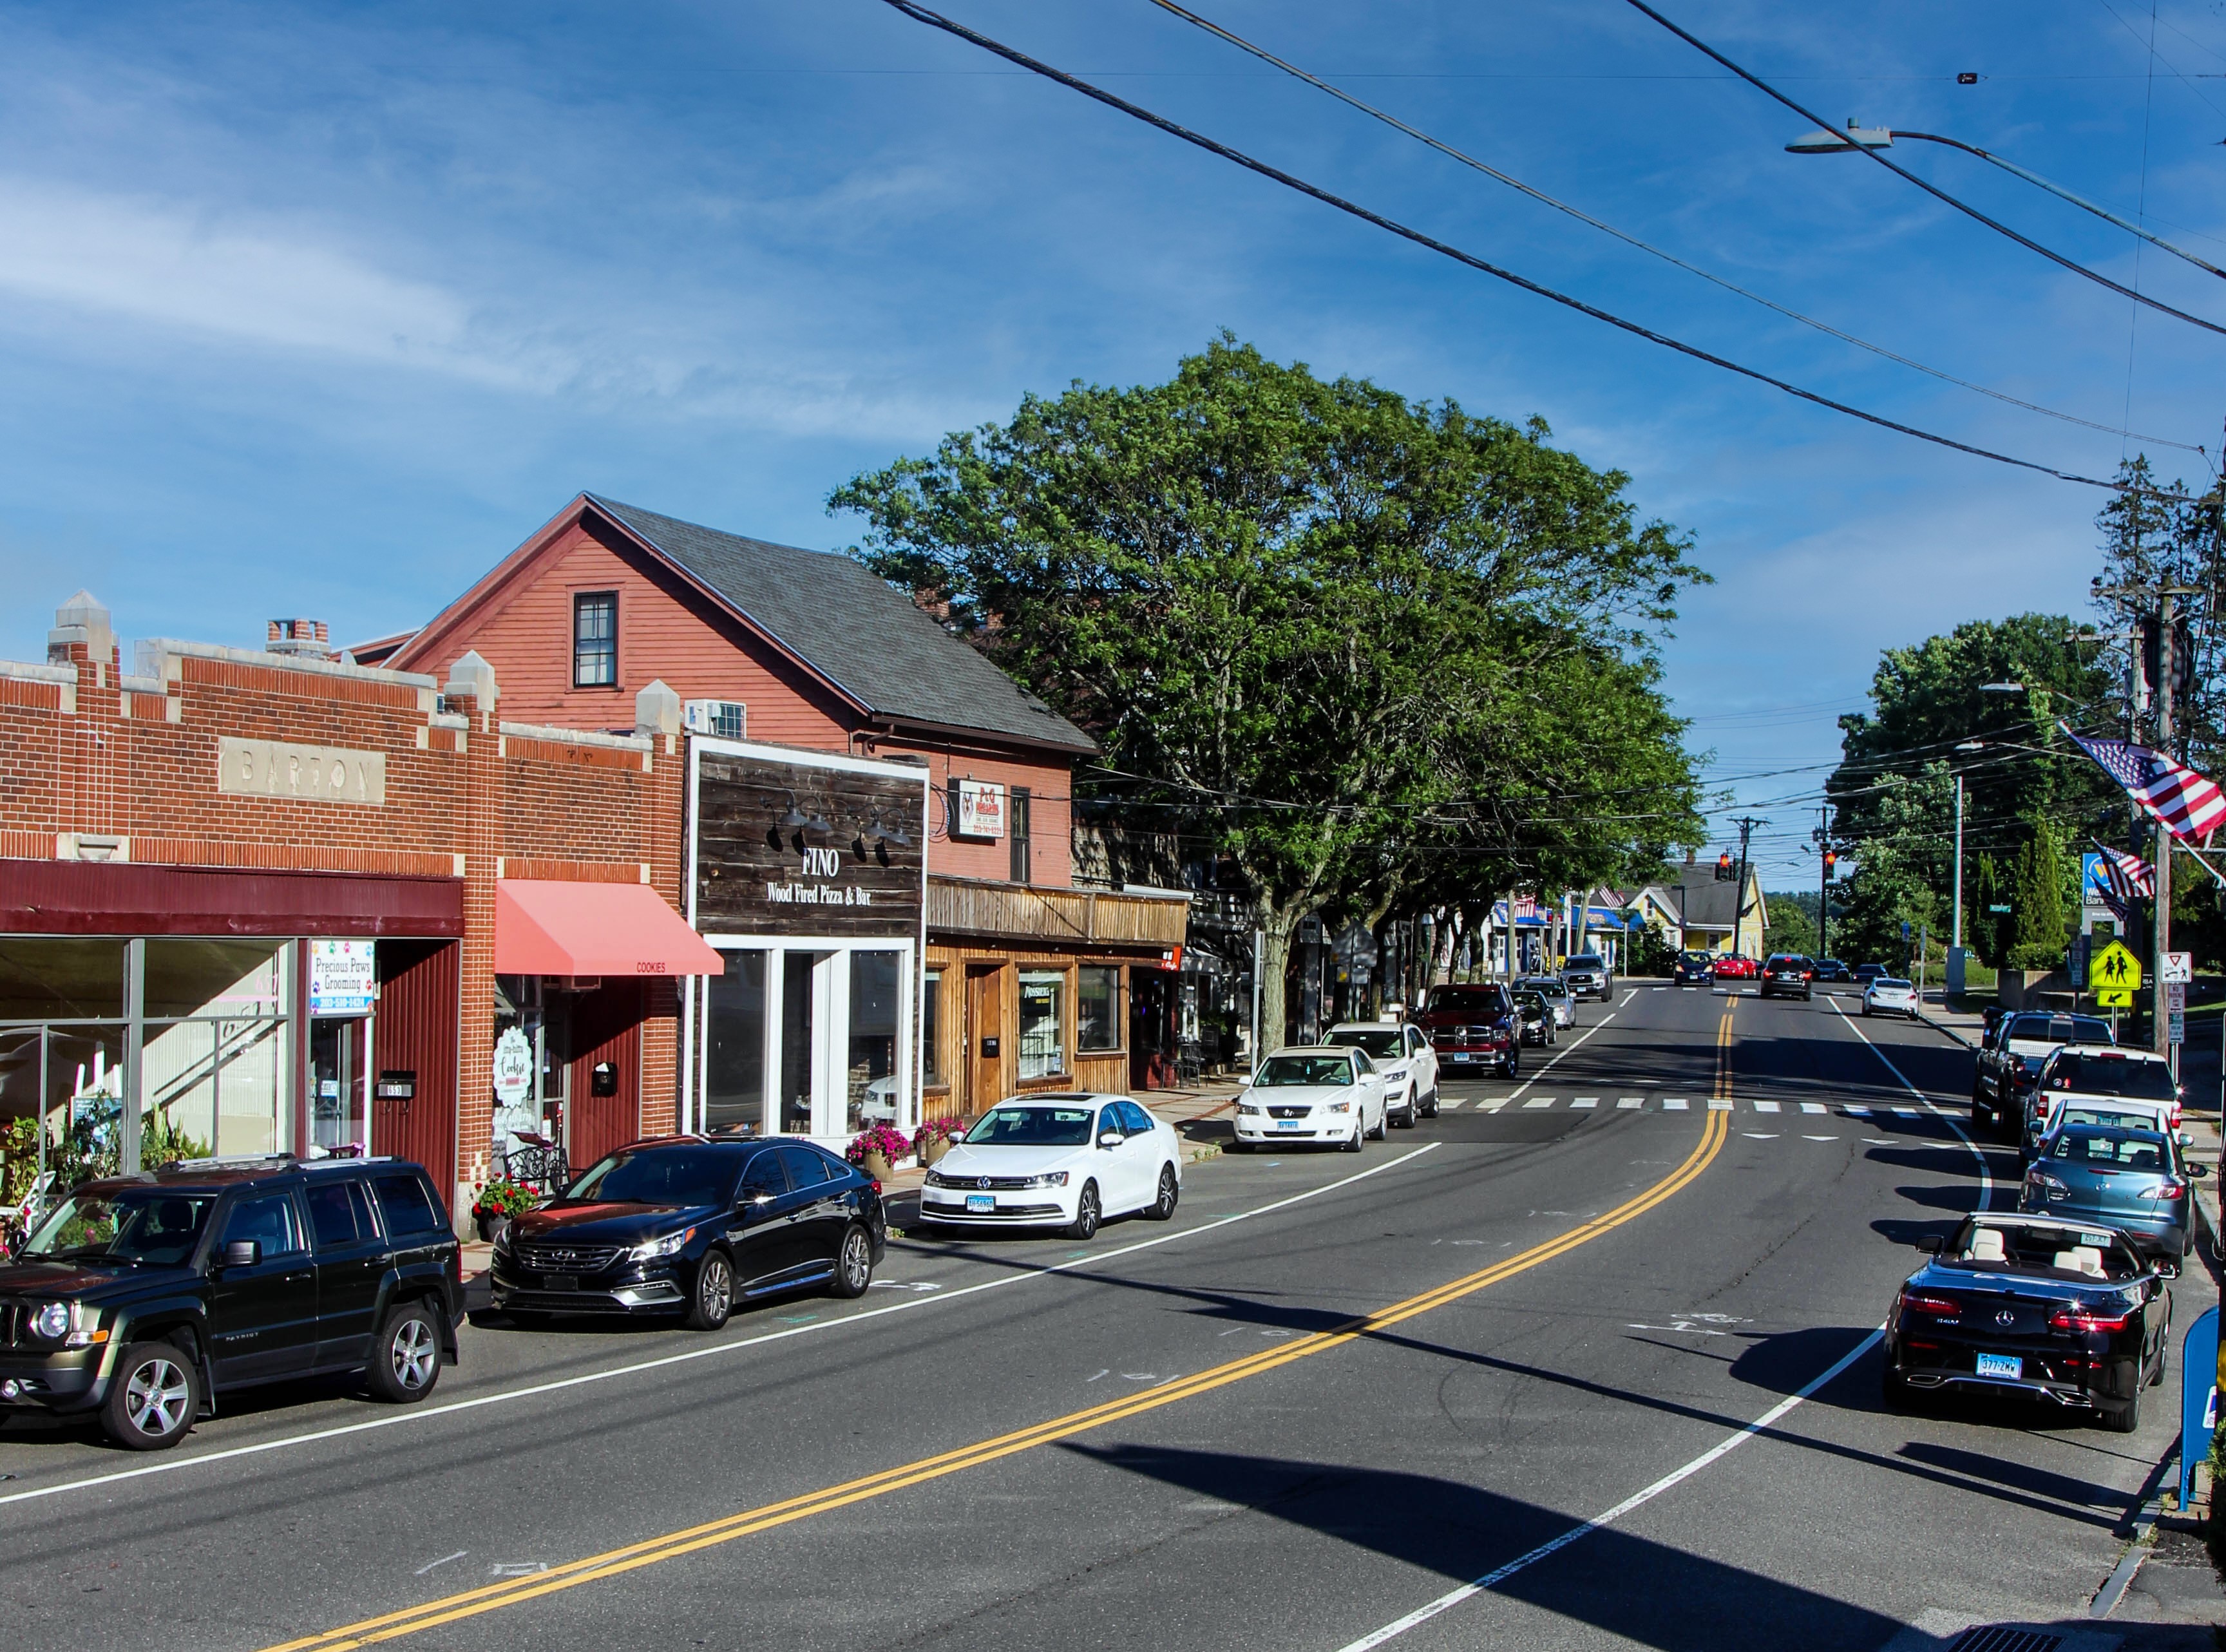
Watertown, CT Infrastructure Assessment
Summary
- Data delivered in weeks empowered Watertown to move fast on visible street repairs residents care about
- 145 roadway miles scanned and 4,505 signs inventoried created defensible, transparent plans
- Fewer complaints and smoother town meetings as leaders communicate clear, data‑backed priorities
Problem
Watertown’s pavement and traffic asset records were outdated and inconsistent, leaving staff unsure which roads to fix and when, and making it hard to build accurate paving budgets. With limited documentation to justify choices, public works leaders often found themselves playing defense in town meetings, fielding “Why not my road?” questions and a steady stream of 311 emails. Manual windshield surveys could not keep pace with changing conditions, and by the time reports were compiled, the data was already stale.
Solution
The Town chose Cyvl to rapidly survey every public roadway using vehicle‑mounted LiDAR and sensors, capturing high‑resolution surface conditions and traffic assets across the community. Within weeks, Cyvl’s Infrastructure Intelligence platform processed the results into detailed pavement condition scores for all 145 miles and a complete inventory of 4,505 signs, along with prioritized repair lists and clear, defensible plan options. The platform’s AI produced actionable reports, budget scenarios, and GIS layers that empowered Watertown’s leaders to make faster, data‑driven decisions and communicate them with confidence.
Impact
By September 23, 2022, Watertown had a complete, town‑wide street and sign dataset that turned uncertainty into action. Delivery in weeks, not months, shortened the time between data collection and project implementation, so residents saw improvements sooner. With transparent condition scores and priority candidate lists, leaders could schedule work, align budgets, and explain timelines clearly to the community.
- 145 roadway miles scanned with LiDAR and sensors, translated into street‑level condition scores and GIS layers used to sequence repairs faster
- 4,505 traffic signs inventoried, enabling targeted replacements that improve safety at crossings, school zones, and high‑risk locations
- Defensible paving and maintenance plans produced in weeks, helping the Town respond to community needs quickly and reduce 311 complaints
- Clear budget scenarios that show efficient use of taxpayer dollars and support stronger funding requests and grants
- Work scheduling and coordination simplified, accelerating pothole patching and resurfacing where it delivers the greatest resident impact
- Public communication improved with maps and metrics, making town meetings smoother and building trust through transparent, consistent decisions


-%20logo%20(unpadded).png.png)