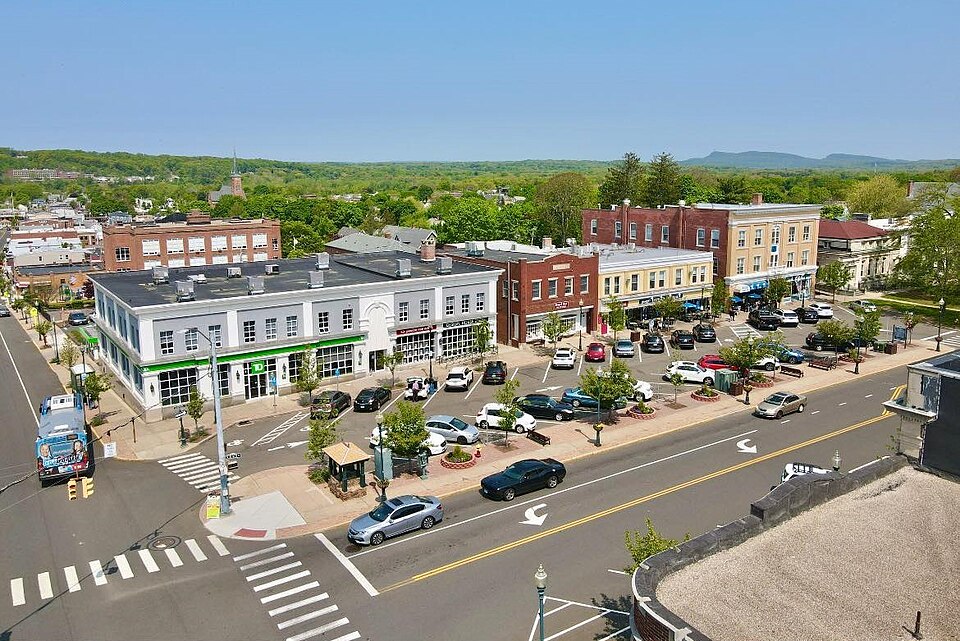
Wallingford, CT
With trusted, current data, Wallingford built a comprehensive paving program in a fraction of the usual time and aligned it to funding windows and construction seasons.

Wallingford, CT Infrastructure Assessment
Summary
- 217 roadway miles scanned and analyzed by May 15, 2025, accelerating repairs residents can see and feel
- Weeks not months data delivery cut the gap between assessment and construction, speeding safety improvements
- Clear, defensible plans improved town meetings and confidence in how taxpayer dollars are spent
Problem
Wallingford, CT faced familiar pavement challenges with outdated and inconsistent condition data, making it hard to know which roads to fix and when. Without a clear prioritization method and a defensible paving plan, the city had to react to complaints, answer “Why not my road?” in public meetings, and spend staff time on 311 responses instead of repairs. Manual windshield surveys were slow and subjective, budgets were hard to defend, and reporting lag meant the data was old by the time crews could act—putting leaders under pressure while residents waited.
Solution
To take control, Wallingford chose Cyvl to rapidly survey the entire network, capturing 217 roadway miles with vehicle-mounted LiDAR and calibrated sensors. Within weeks, Cyvl’s Infrastructure Intelligence platform used AI to convert raw scans into detailed, actionable pavement condition data for all 217 miles—complete with street-level condition scores, distress mapping, and prioritized repair lists aligned to realistic budget scenarios. The city received defensible plans and concise reports by May 15, 2025, enabling engineers, finance, and public works to coordinate decisions and move projects into construction faster.
Impact
With trusted, current data, Wallingford built a comprehensive paving program in a fraction of the usual time and aligned it to funding windows and construction seasons. By connecting needs, costs, and timelines, leaders can show efficient use of taxpayer dollars and explain choices clearly to residents, reducing friction in council and town-hall meetings. Most important, weeks not months delivery shortened the window from data collection to implementation, so high-priority segments get repaired sooner and daily driving becomes safer.
- 217 roadway miles scanned with LiDAR and HD imagery produced objective condition scores and repair recommendations residents understand
- Delivery by May 15, 2025 allowed crews to slot projects into the summer paving window sooner, cutting wait times for neighborhoods
- Faster response to community needs as staff shift from reactive 311 handling to data-scheduled repairs
- Safer, smoother streets as potholes and hazardous segments are identified early and queued for timely fixes
- Easier budget approvals and accountability with clear treatment options, unit costs, and a defensible plan residents can see
- Budget allocation, public communication, and crew scheduling became straightforward with reliable data guiding every step


-%20logo%20(unpadded).png.png)
Infrastructure intelligence. From capture to capital plan.