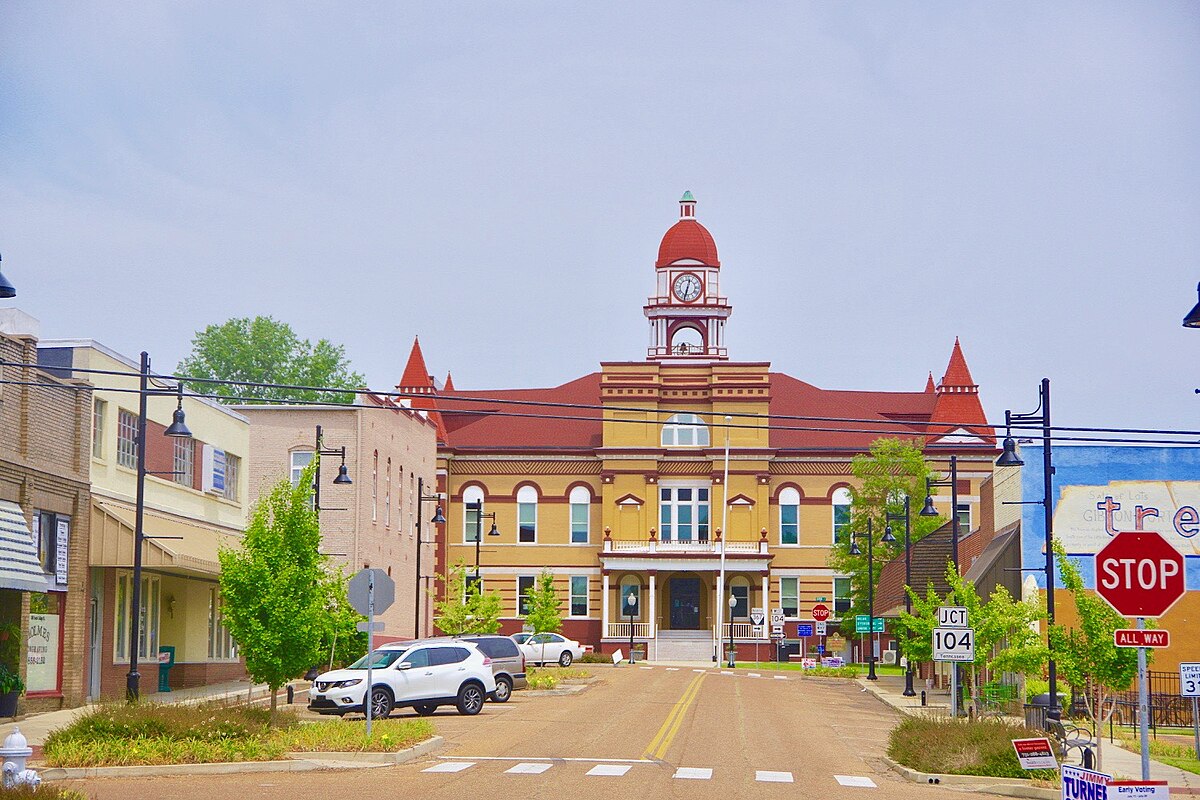
Trenton, TN
Armed with trustworthy, citywide pavement intelligence, Trenton shifted from reactive firefighting to proactive programming in a single budget cycle.

Trenton, TN Infrastructure Assessment
Summary
- Data-rich street and asset inventory delivered in weeks by July 29, 2025, accelerating repairs residents can see
- 853 roadway miles scanned with LiDAR, plus 4,008 signs and 430 guardrails inventoried to target safety and pavement fixes faster
- Clear, defensible plans and transparent reports reduced complaints, sped approvals, and improved use of taxpayer dollars
Problem
Trenton faced paving decisions without a current, citywide view of street conditions; the team relied on outdated or inconsistent data and spot checks that missed hidden failures. With no clear prioritization method, plans often defaulted to reacting to complaints, making it hard to build defensible paving plans and answer “Why not my road?” in town meetings. Budget requests were also difficult to justify because the city could not show efficient use of taxpayer dollars with credible, up-to-date measurements.
Solution
To modernize its approach, Trenton selected Cyvl to perform a rapid, vehicle-based survey using LiDAR and sensors across 853 roadway miles. Within weeks, the Infrastructure Intelligence platform used AI to turn the raw survey into detailed pavement condition scores, geo-referenced distresses, and prioritized repair lists, along with a complete inventory of 4,008 signs and 430 guardrails. Delivered by July 29, 2025, the city gained defensible plans and board-ready reports, enabling leaders to make confident, data-driven decisions and schedule work faster.
Impact
Armed with trustworthy, citywide pavement intelligence, Trenton shifted from reactive firefighting to proactive programming in a single budget cycle. The weeks-not-months delivery by July 29, 2025 shortened the time between data collection and construction, allowing crews to address the most critical segments sooner and demonstrate quick wins to residents. Clear condition scores and asset maps strengthened budget narratives, streamlined public communication, and aligned day-to-day work with long-term goals.
- 853 roadway miles scanned with LiDAR and sensors provided block-by-block clarity so crews know exactly where to deploy first
- 4,008 signs inventoried and 430 guardrails mapped improved safety planning and helped prioritize replacements that matter most to drivers, buses, and school routes
- Residents see faster pothole and pavement repairs because project scoping and approvals now happen in weeks, not months
- Town meetings run smoother with transparent maps, condition scores, and defensible project lists to answer “Why not my road?” with facts
- Fewer 311 complaints as proactive maintenance reduces surprises and schedules are communicated ahead of time
- Budget allocation and grant applications are easier to defend, unlocking timely funding and delivering better value for taxpayers
- Work scheduling and crew routing are streamlined, cutting windshield time and focusing staff on high-impact repairs


-%20logo%20(unpadded).png.png)