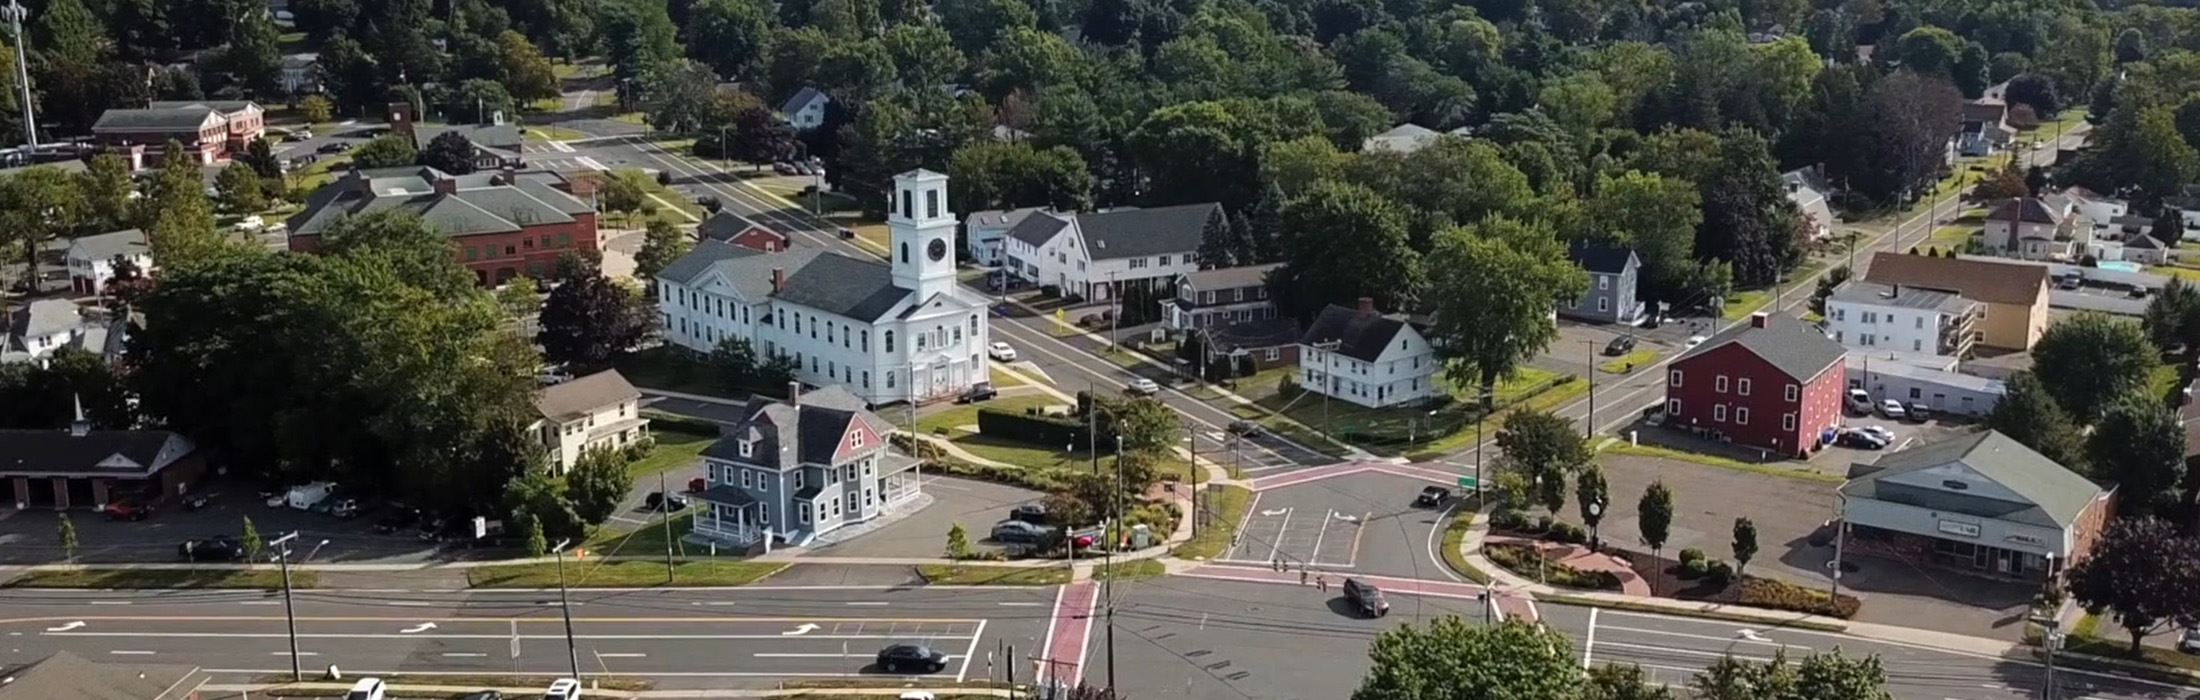
Rocky Hill, CT
With precise pavement condition data for 70 miles, Rocky Hill shifted from reactive to proactive, focusing crews where residents would feel results fastest.
Rocky Hill, CT Infrastructure Assessment
Summary
- Weeks, not months: LiDAR scan and analysis of 70 roadway miles delivered by July 30, 2024
- Actionable pavement condition scores and segment-level repair priorities residents can understand
- Faster paving and maintenance decisions that save taxpayer dollars and reduce complaints
Problem
Rocky Hill was managing aging pavement across neighborhoods and arterials but lacked current, consistent data, making it hard to know which roads to fix and when. Prior windshield surveys were manual, slow, and inconsistent, so by the time reports were compiled the information was already outdated. Without defensible condition scores, staff were stuck reacting to complaints and struggled to justify paving budgets in town meetings, leading to the constant “Why not my road?” question.
Solution
The city chose Cyvl to rapidly survey the entire street network; vehicle-mounted LiDAR and sensors captured Rocky Hill’s 70 roadway miles with high-resolution data in days. Cyvl’s Infrastructure Intelligence platform used AI to transform the data into block-by-block condition scores, quantified distresses, cost models, and prioritized repair lists aligned to the city’s goals and budget. Delivered by July 30, 2024, Rocky Hill received detailed, actionable pavement condition data and defensible reports that enabled a comprehensive paving program and faster, confident decision-making.
Impact
With precise pavement condition data for 70 miles, Rocky Hill shifted from reactive to proactive, focusing crews where residents would feel results fastest. Weeks-not-months delivery shortened the planning window, reducing the time between data collection and project implementation so work could begin in the same construction season. Clear scores, maps, and cost scenarios helped leaders explain choices, secure support, and coordinate projects to improve safety and reduce frustration.
- Shortened planning cycle from months to weeks, accelerating repairs residents can see this year
- Transparent condition maps and segment priorities reduced 311 volume and “Why not my road?” debates
- Data-driven budget allocation targeted high-need corridors while stretching taxpayer dollars further
- Crews scheduled work more efficiently, cutting idle time and improving work zone safety
- Town meetings run smoother with clear, defensible reports that show how streets were prioritized
- Support for multi-year funding strengthened with objective condition scores and cost scenarios
- Faster pothole response and resurfacing on priority streets lead to safer, smoother daily commutes
- Budget allocation, public communication, and work scheduling are now streamlined with trusted data


-%20logo%20(unpadded).png.png)