Plymouth, MA
Armed with detailed pavement condition data for all 377 miles and a verified inventory of 7,511 signs, Plymouth quickly turned insights into field-ready actions after February 17, 2023.
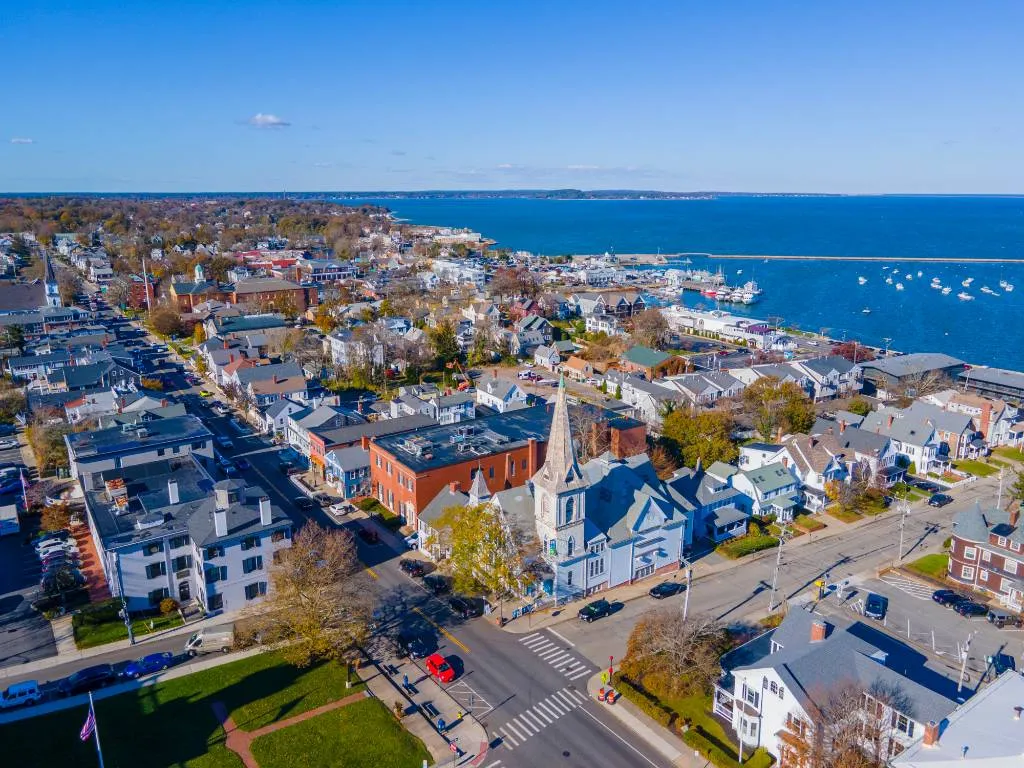
Plymouth, MA Infrastructure Assessment
Summary
- 377 roadway miles rapidly surveyed and analyzed, delivering actionable pavement condition data that sped up repairs for residents
- 7,511 traffic signs inventoried to improve safety, compliance, and day-to-day navigation for drivers, cyclists, and pedestrians
- Results delivered on February 17, 2023, enabling Plymouth to move from reactive responses to proactive, data-driven planning in weeks rather than months
Problem
Plymouth manages hundreds of miles of roadway across coastal neighborhoods and a historic town center, but records were outdated or inconsistent, making it hard to know which roads to fix and when. Without a clear prioritization method, staff struggled to build defensible paving plans and often had to be reactive to complaints—fueling the “Why not my road?” debate and pulling crews off schedule. Manual surveys were expensive and slow, and by the time reports were compiled the data was already stale, making it hard to defend budgets and show efficient use of taxpayer dollars.
Solution
Plymouth chose to modernize its approach by using Cyvl to capture reliable, current pavement and asset data and turn it into action. Cyvl used vehicle-mounted LiDAR and sensors to rapidly survey 377 roadway miles, then the Infrastructure Intelligence platform used AI to produce block-level condition scores, prioritized repair lists, and clear, map-based reports. With trustworthy analytics in hand, Plymouth unlocked defensible plans supported by data, accelerating decisions, work scheduling, and communication with residents and elected leaders.
Impact
Armed with detailed pavement condition data for all 377 miles and a verified inventory of 7,511 signs, Plymouth quickly turned insights into field-ready actions after February 17, 2023. Crews scheduled targeted repairs and preservation treatments based on objective scores and context, speeding up pothole fixes and extending pavement life to save taxpayer dollars. City leaders used clear maps and reports to explain decisions, answer resident questions, and streamline budget approvals so projects could start sooner.
- 377 roadway miles scanned with LiDAR and HD imagery, delivering block-level condition scores the city used to schedule work faster
- 7,511 traffic signs inventoried to support safer travel, ADA checks, and targeted replacements where they matter most
- Data and reports delivered by February 17, 2023 reduced planning cycles from months to weeks, shrinking time from survey to construction
- Faster pothole repairs and resurfacing on critical segments reduced flat tires and damage complaints for residents
- Town meetings run smoother with defensible maps and criteria, reducing “Why not my road?” debates and building trust
- Fewer 311 complaints as communication improves and work orders align with objective condition data
- Budget requests are easier to defend, showing efficient use of taxpayer dollars and unlocking funds for preventative maintenance
- Public works schedules are more predictable, letting crews plan lane closures and notifications to minimize disruption


-%20logo%20(unpadded).png.png)