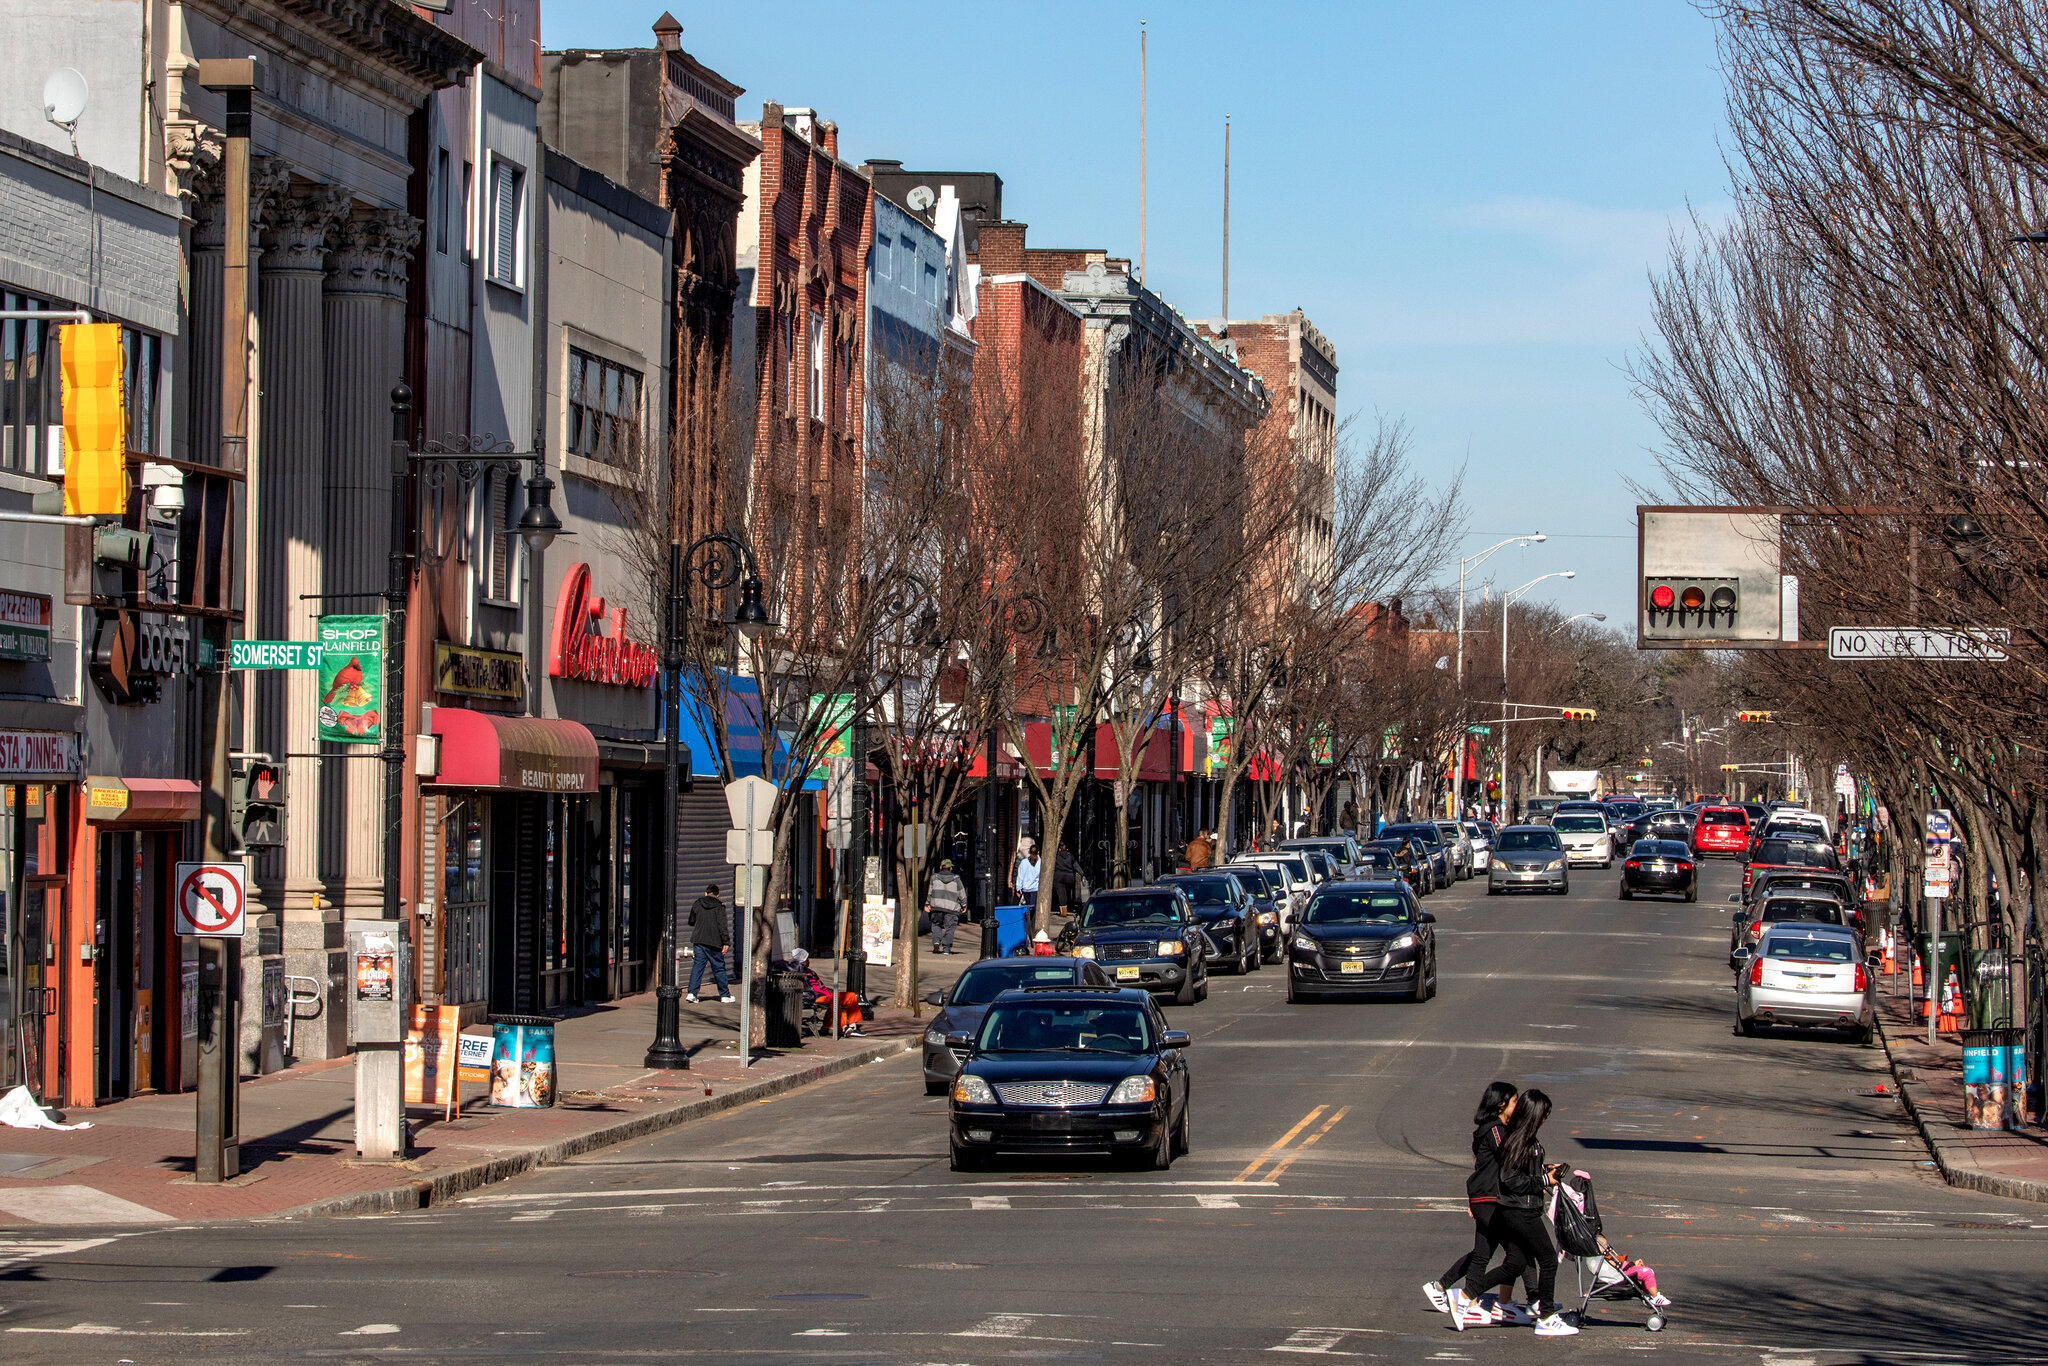
Plainfield, NJ
By September 4, 2025, Plainfield had a verified inventory of 6,182 assets, including 3,492 manhole covers, 2,500 catch basins, and 190 flashing beacons, all linked to map locations and condition details.

Plainfield, NJ Infrastructure Assessment
Summary
- Weeks-not-months delivery of a citywide, AI-ready inventory of 6,182 critical drainage and safety assets by September 4, 2025
- Clear, defensible plans that turn confusion into faster, targeted fixes residents can see
- Safer travel and fewer complaints as the city moves from reactive patching to proactive maintenance
Problem
Plainfield’s public works team relied on outdated, inconsistent records and scattered spreadsheets, leaving no complete asset inventory of critical drainage and safety infrastructure. Without reliable data, staff struggled to build defensible work plans, defaulted to reacting to complaints, and faced “Why not my road?” questions at council meetings. Guesswork made it hard to justify budgets or schedule the right repairs at the right time for residents.
Solution
Plainfield selected Cyvl to rapidly map the right-of-way using vehicle-mounted LiDAR and sensors, capturing high-resolution locations and conditions for manhole covers, catch basins, flashing beacons, and pavement surfaces block by block. Within Cyvl’s Infrastructure Intelligence platform, AI transformed the raw data into pavement condition scores, asset condition ratings, and risk-ranked repair lists tied to costs and crew activities. The city received defensible, ready-to-execute plans and transparent reports that made it easy to prioritize projects, coordinate utilities, and communicate decisions to residents in weeks, not months.
Impact
By September 4, 2025, Plainfield had a verified inventory of 6,182 assets, including 3,492 manhole covers, 2,500 catch basins, and 190 flashing beacons, all linked to map locations and condition details. With complete, trustworthy data and condition scoring, the city created a comprehensive plan in less time, launched targeted repairs, and scheduled maintenance where it would help residents most. Crews moved from reactive tickets to proactive work orders, budgets were easier to defend, and communication with the public became straightforward.
- Faster emergency response and routine maintenance reduce flooding hotspots and travel delays after storms
- Clear, data-backed schedules mean drainage and pavement fixes get done sooner, improving ride quality and safety
- Fewer 311 complaints as residents see progress mapped and explained with photos, scores, and timelines
- Funding requests backed by objective scores and unit costs earn approval, directing taxpayer dollars where they have the biggest impact
- Public meetings go smoother with transparent maps, condition grades, and timelines that answer “Why not my street?” without politics
- Operations teams save time by generating work orders and capital plans directly from the platform, accelerating construction start dates by weeks
- Coordinated safety upgrades near schools and bus routes reduce risk for pedestrians and drivers


-%20logo%20(unpadded).png.png)