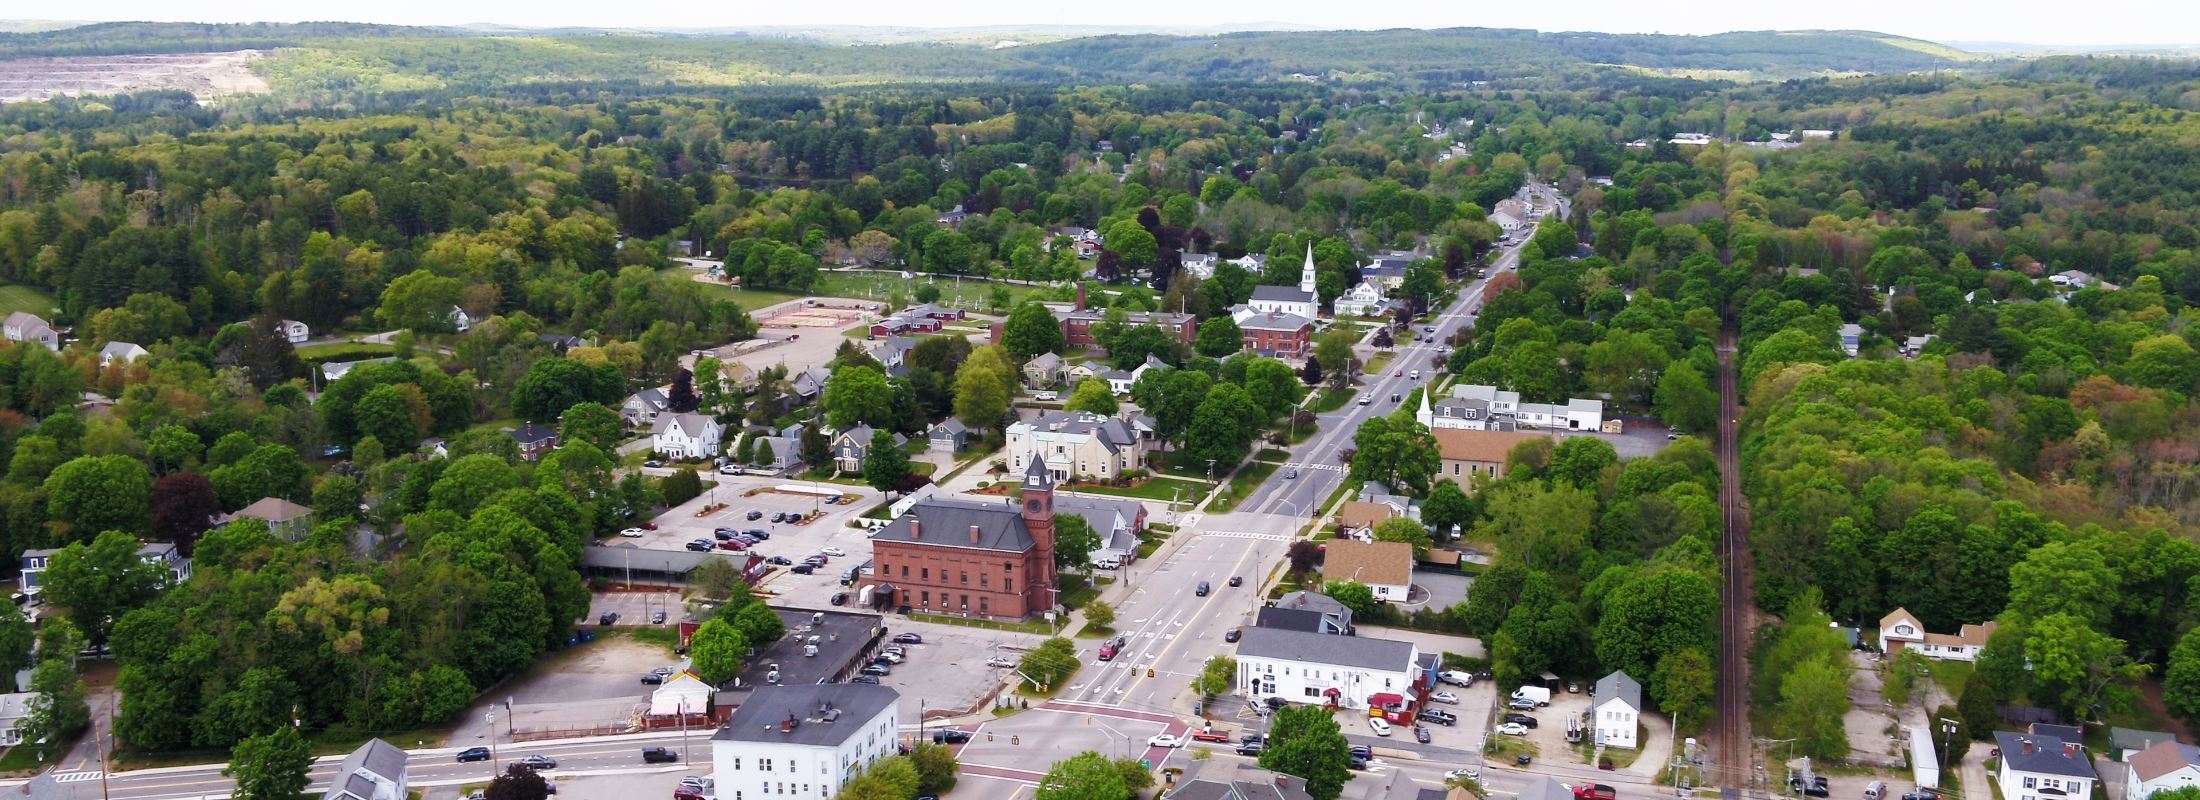
Oxford, MA
By October 15, 2024, Oxford had a current, citywide pavement baseline for all 91 miles, with detailed, actionable condition scores for every segment.

Oxford, MA Infrastructure Assessment
Summary
- Oxford scanned 91 roadway miles and received citywide condition scores in weeks, not months
- Built a defensible, data-driven paving program and budget with clear priorities and timelines
- Residents benefit from faster fixes, safer streets, and fewer 311 complaints through transparent communication
Problem
Oxford’s road network faces heavy wear from New England freeze–thaw cycles and busier commuter corridors, but decisions were based on outdated or inconsistent data, leaving no accurate paving budgets or shared baseline. Without a clear prioritization method to build defensible paving plans, crews were often reactive to complaints and leaders struggled to justify choices in town meetings. Manual windshield inspections could not keep pace and were unsafe on busier routes, so information was stale by the time reports were compiled, delaying visible improvements for residents.
Solution
Oxford chose Cyvl to rapidly survey the entire network with vehicle‑mounted LiDAR and sensors, capturing precise condition data across 91 roadway miles. Cyvl’s Infrastructure Intelligence platform used AI to convert raw scans into segment‑level condition scores, distress insights, prioritized repair lists, budget scenarios, and ready‑to‑present reports. Delivered by October 15, 2024, the city had actionable plans in weeks—not months—enabling confident scheduling and defensible, transparent decisions backed by detailed analysis.
Impact
By October 15, 2024, Oxford had a current, citywide pavement baseline for all 91 miles, with detailed, actionable condition scores for every segment. With reliable data, leadership built a comprehensive paving program and aligned budgets quickly, moving from reactive fixes to planned work that residents can see on the ground sooner. The new clarity improved safety, reduced delays between inspection and construction, and gave staff clear talking points for public meetings and online updates.
- 91 roadway miles scanned with LiDAR and sensors created a defensible condition map residents can trust
- Plans and reports delivered in weeks, not months, cut planning time and accelerated paving and patching schedules
- Data‑driven priorities enable faster repairs on critical corridors, safer school and emergency routes, and fewer flat tires
- Clear visuals and segment scores make town meetings smoother and reduce “Why not my road?” complaints
- Budget requests are easier to defend, helping secure funding and allocate taxpayer dollars to the highest community benefit
- Work scheduling, contractor scoping, and public communication are now streamlined because teams share one source of truth


-%20logo%20(unpadded).png.png)