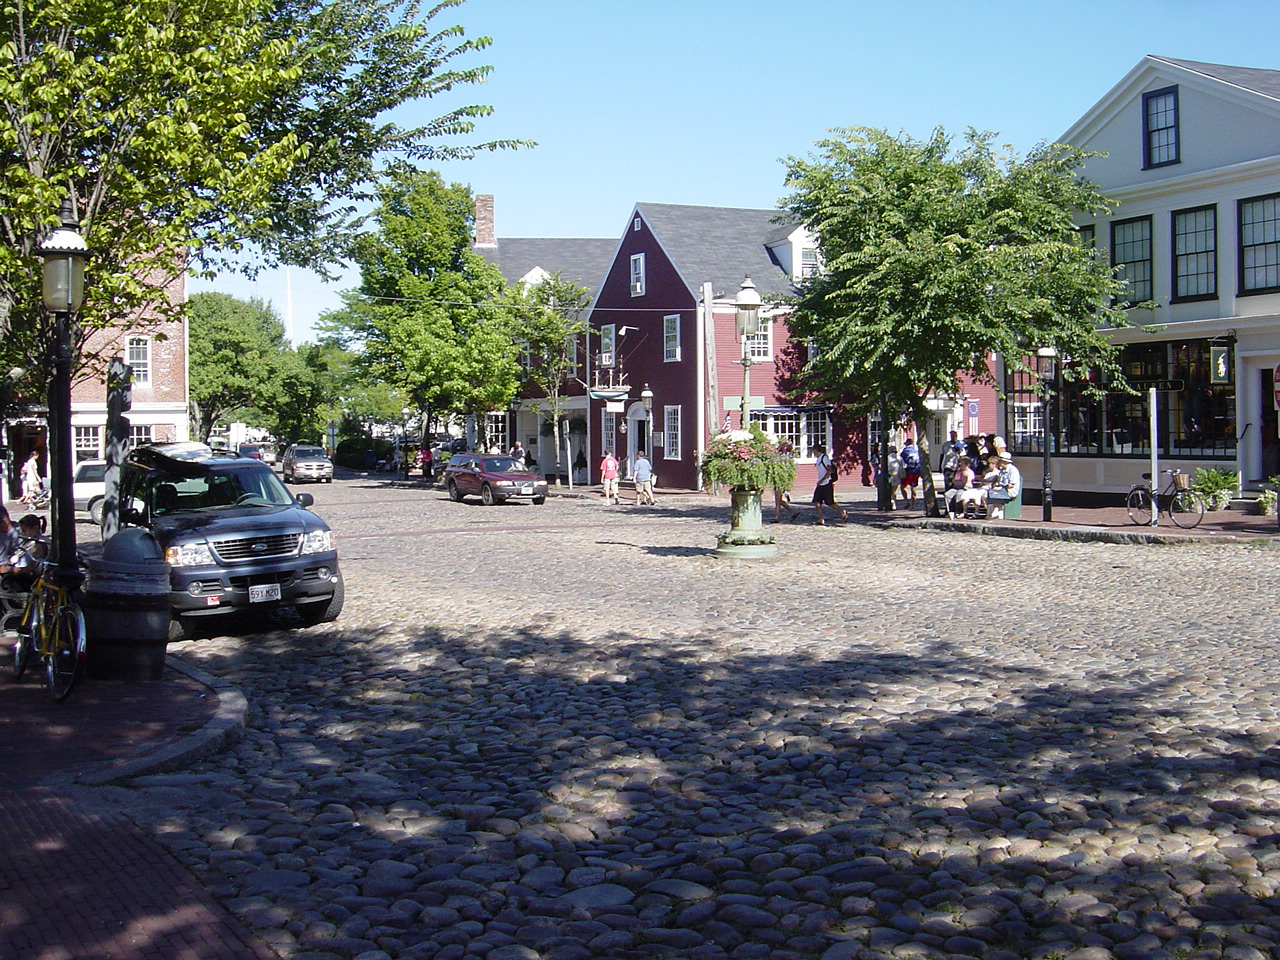
Nantucket, MA
By January 23, 2023, Nantucket had a complete, street-level picture of its network—delivered in weeks, not months—so work could start sooner and residents could see progress faster.
Nantucket, MA Infrastructure Assessment
Summary
- 83 roadway miles scanned with LiDAR and sensors, delivered January 23, 2023
- Actionable pavement condition scores enabled a clear, defensible paving program
- Weeks-not-months delivery translated to faster fixes and clearer timelines for residents
Problem
Nantucket’s public works team faced island-specific wear from salt air, freeze–thaw cycles, and heavy seasonal traffic, but their pavement information was outdated and inconsistent, leaving them unsure which roads to fix or when and unable to produce accurate paving budgets. Staff relied on manual windshield and walking surveys that were slow, unsafe, and already stale by the time budget season arrived. Without current, reliable data, the city played defense to “Why not my road?” questions at meetings and struggled to prioritize work in a transparent, non-political way.
Solution
Nantucket chose Cyvl to rapidly digitize its network, capturing 83 roadway miles with vehicle-mounted LiDAR and high-resolution sensors. Within weeks, Cyvl’s Infrastructure Intelligence platform used AI to convert the raw scans into detailed, actionable pavement condition data for every block, complete with objective condition scores, prioritized repair lists, and turnkey reports. With this defensible insight in hand by January 23, 2023, city leaders assembled a transparent plan, communicated it clearly, and moved from reactive to proactive action.
Impact
By January 23, 2023, Nantucket had a complete, street-level picture of its network—delivered in weeks, not months—so work could start sooner and residents could see progress faster. The team used the objective analysis across 83 miles to schedule the right treatment at the right time, tighten cost estimates, and show taxpayers exactly how dollars would be used. With clear data, public communication improved, bidding and construction windows aligned to island logistics, and crews focused on the highest-priority needs without guesswork.
- Faster pothole repairs and safer travel as crews target issues based on real, current conditions
- Fewer 311 complaints and clearer answers to “Why not my road?” with transparent, map-based condition scores
- Budget proposals grounded in objective data, making it easier to secure paving dollars and plan multi-year programs
- Work scheduling streamlined—crews, materials, and contractors aligned to a block-by-block plan
- Public meetings run smoother with visuals and metrics that explain timing, tradeoffs, and resident benefits
- Taxpayer funds allocated more efficiently across preservation, rehabilitation, and reconstruction to extend pavement life


-%20logo%20(unpadded).png.png)