Moses Lake, WA
With a complete, trusted dataset across the network, the city now launches projects faster and targets the highest-impact segments first, shrinking the time from survey to construction.
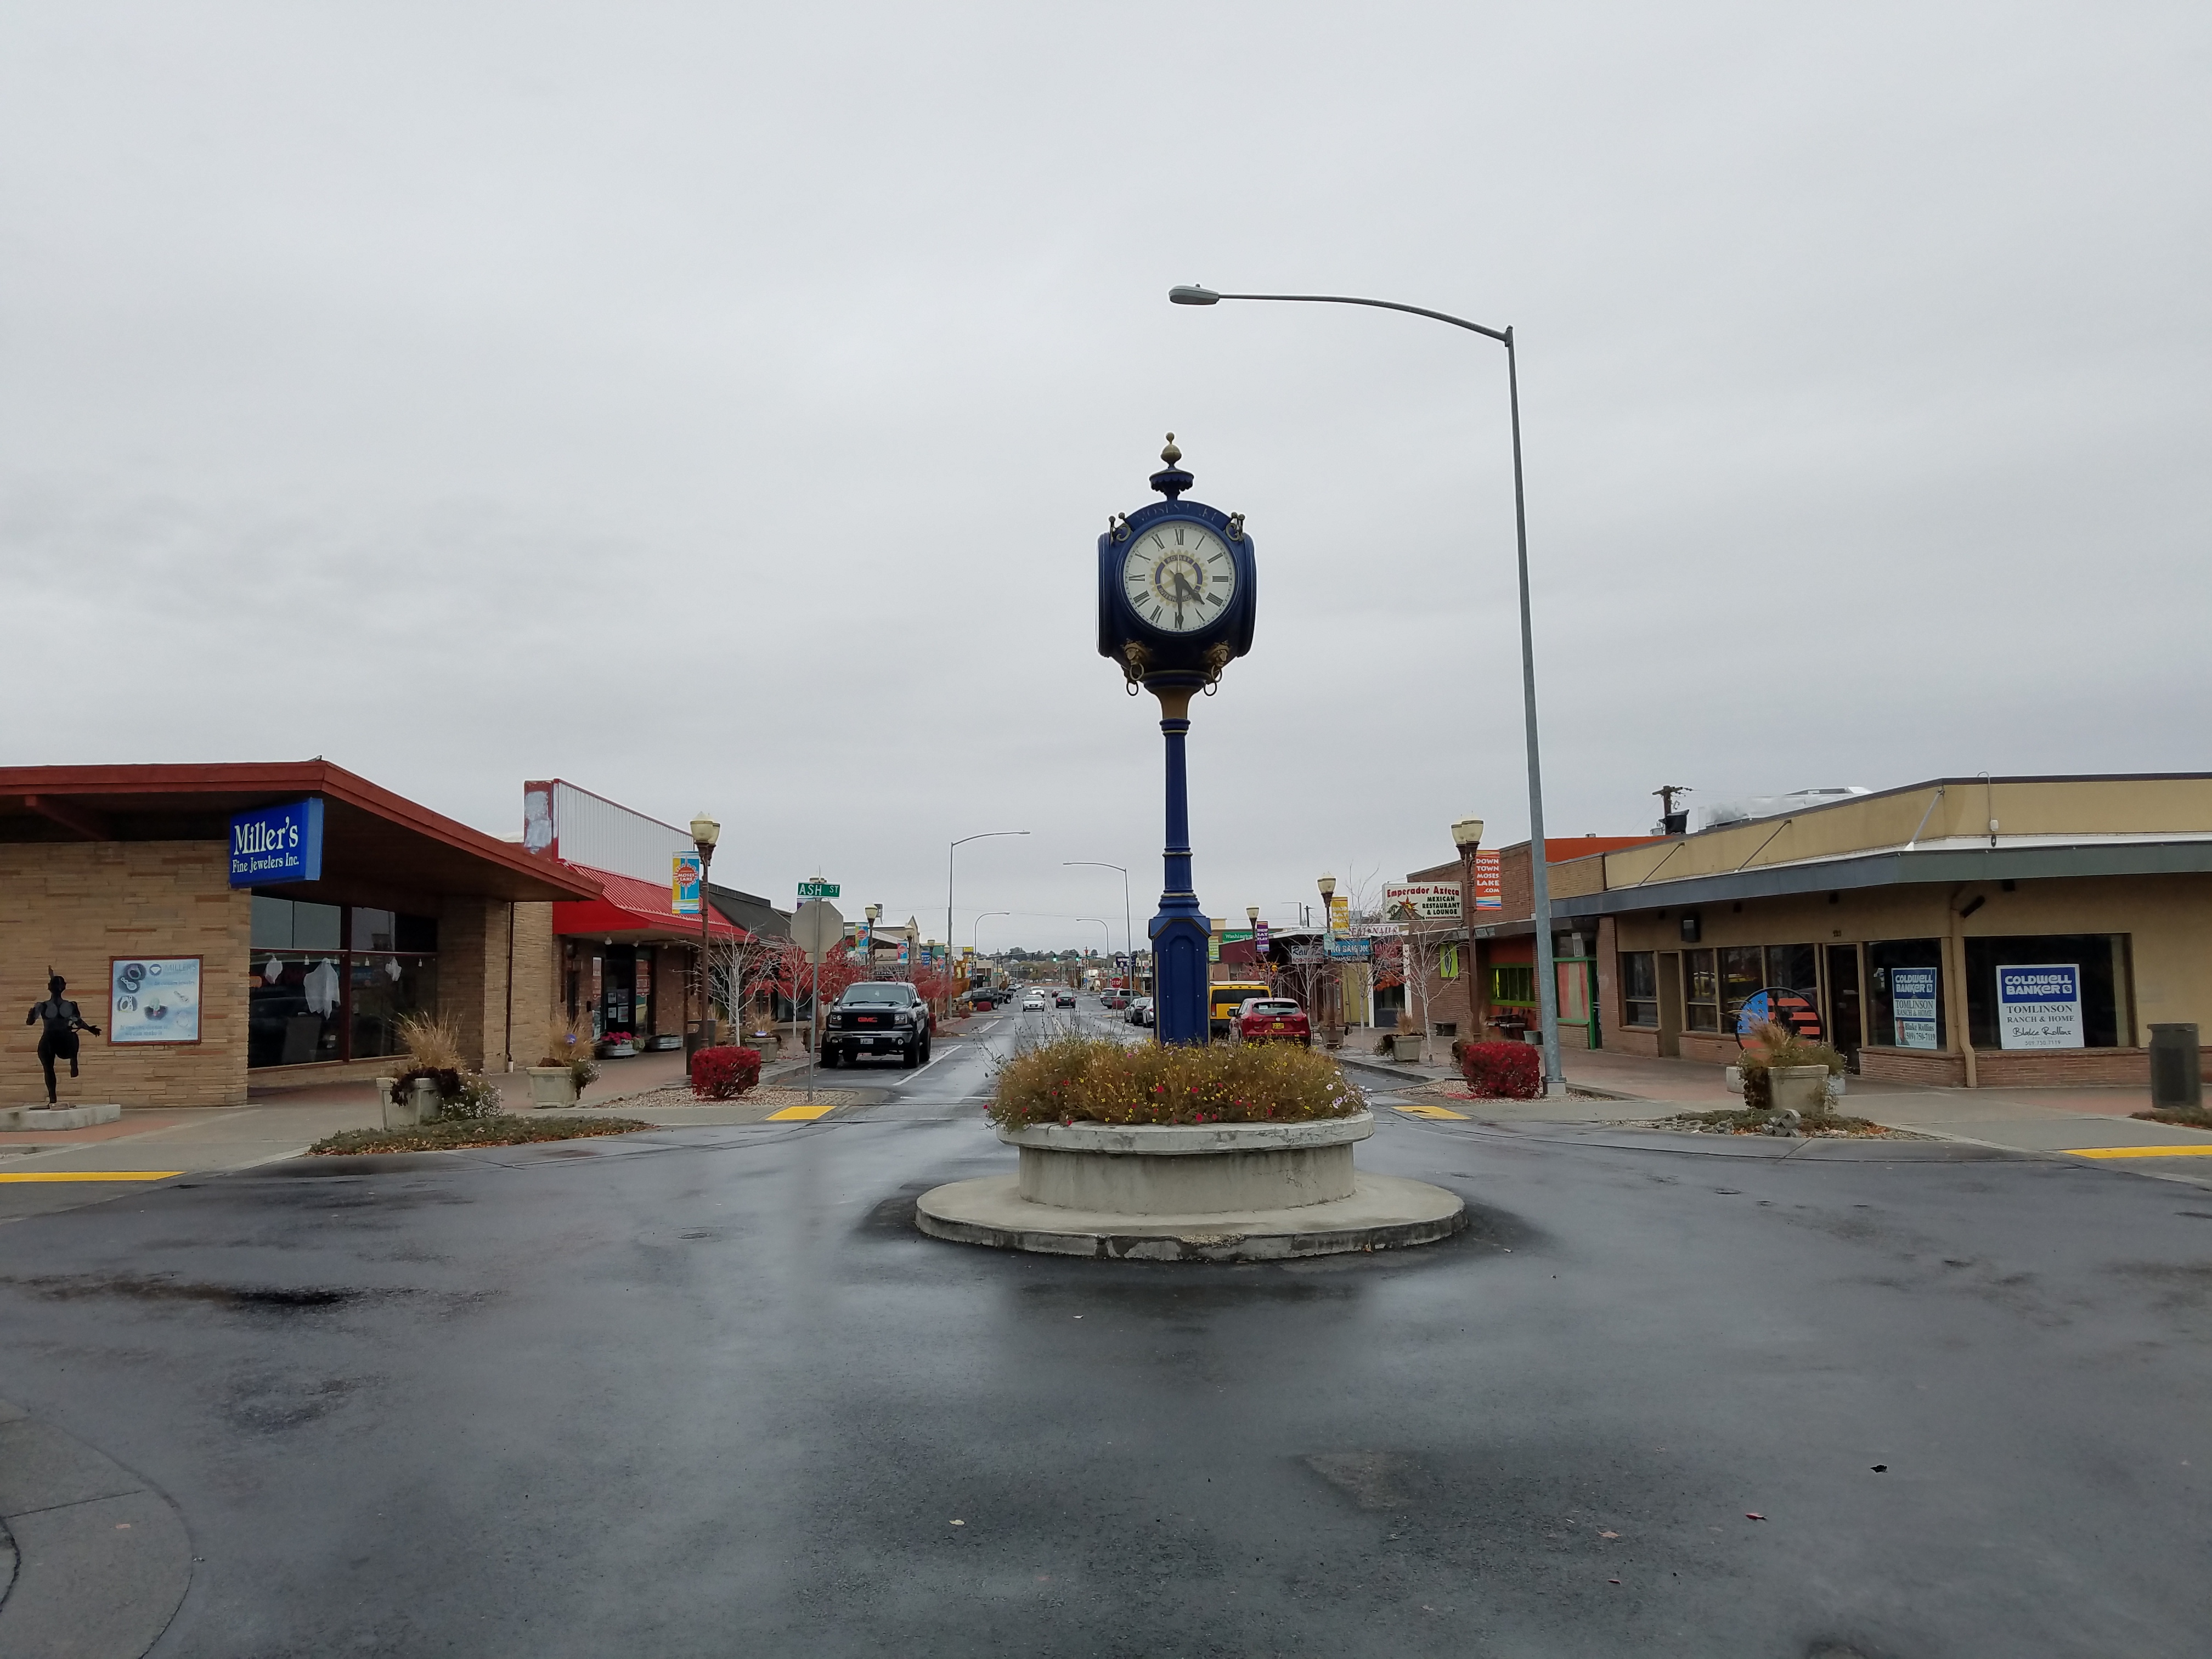
Moses Lake, WA Infrastructure Assessment
Summary
- Weeks-fast LiDAR survey and AI analysis delivered on June 23, 2024, accelerating street fixes residents can see
- 158 roadway miles scanned with detailed pavement condition data and 15,375 assets mapped for confident planning
- Transparent, defensible reports that strengthen budgets, reduce complaints, and target improvements where they help people most
Problem
Moses Lake was operating with outdated and inconsistent infrastructure data, making it hard to know which roads to fix or when. Crews often relied on manual, time-consuming surveys and reacted to complaints, which made paving plans difficult to defend and put staff on their heels in public meetings. Without accurate, current information, the city struggled to show efficient use of taxpayer dollars and set credible, achievable budgets.
Solution
To change this, Moses Lake selected Cyvl to rapidly survey the street network using vehicle-mounted LiDAR and high-resolution sensors, delivering results in weeks and final data on June 23, 2024. Cyvl scanned 158 roadway miles and produced detailed, actionable pavement condition data while inventorying 5,104 signs and a total of 15,375 assets, including 6,789 trees, 4,033 valve covers, 2,362 street lights, and 2,191 curb cuts. Through Cyvl’s Infrastructure Intelligence platform, AI converted the data into clear condition scores, prioritized repair lists, and defensible plans and reports that city leaders use to make better decisions and take action faster.
Impact
With a complete, trusted dataset across the network, the city now launches projects faster and targets the highest-impact segments first, shrinking the time from survey to construction. The asset inventory—5,104 signs and 15,375 mapped features across 158 miles—helps crews coordinate lighting repairs, valve access, tree trimming, and ADA curb cut improvements that residents feel immediately. Clear, visual reports make budget requests straightforward and help staff answer “Why not my road?” with facts, easing town meetings and building community trust.
- Weeks, not months: data delivered on June 23, 2024 enabled immediate work planning and quicker fixes in neighborhoods
- Safer travel as deteriorated segments and hazards are flagged and scheduled sooner, reducing flat tires and detours
- Noticeable drop in 311 complaints as transparent, data-backed timelines replace guesswork
- Crews schedule work more efficiently across 158 miles, cutting rework and improving response to resident requests
- Budget allocation and funding approvals come easier with defensible condition scores and clear cost scenarios
- Street light, tree, and curb cut inventories improve night visibility and ADA access, directly benefiting pedestrians and school routes
- Signs inventory of 5,104 supports faster replacements and compliance, improving safety at intersections and school zones
- Leadership communicates progress with maps and metrics the public understands, strengthening trust in how taxpayer dollars are used


-%20logo%20(unpadded).png.png)