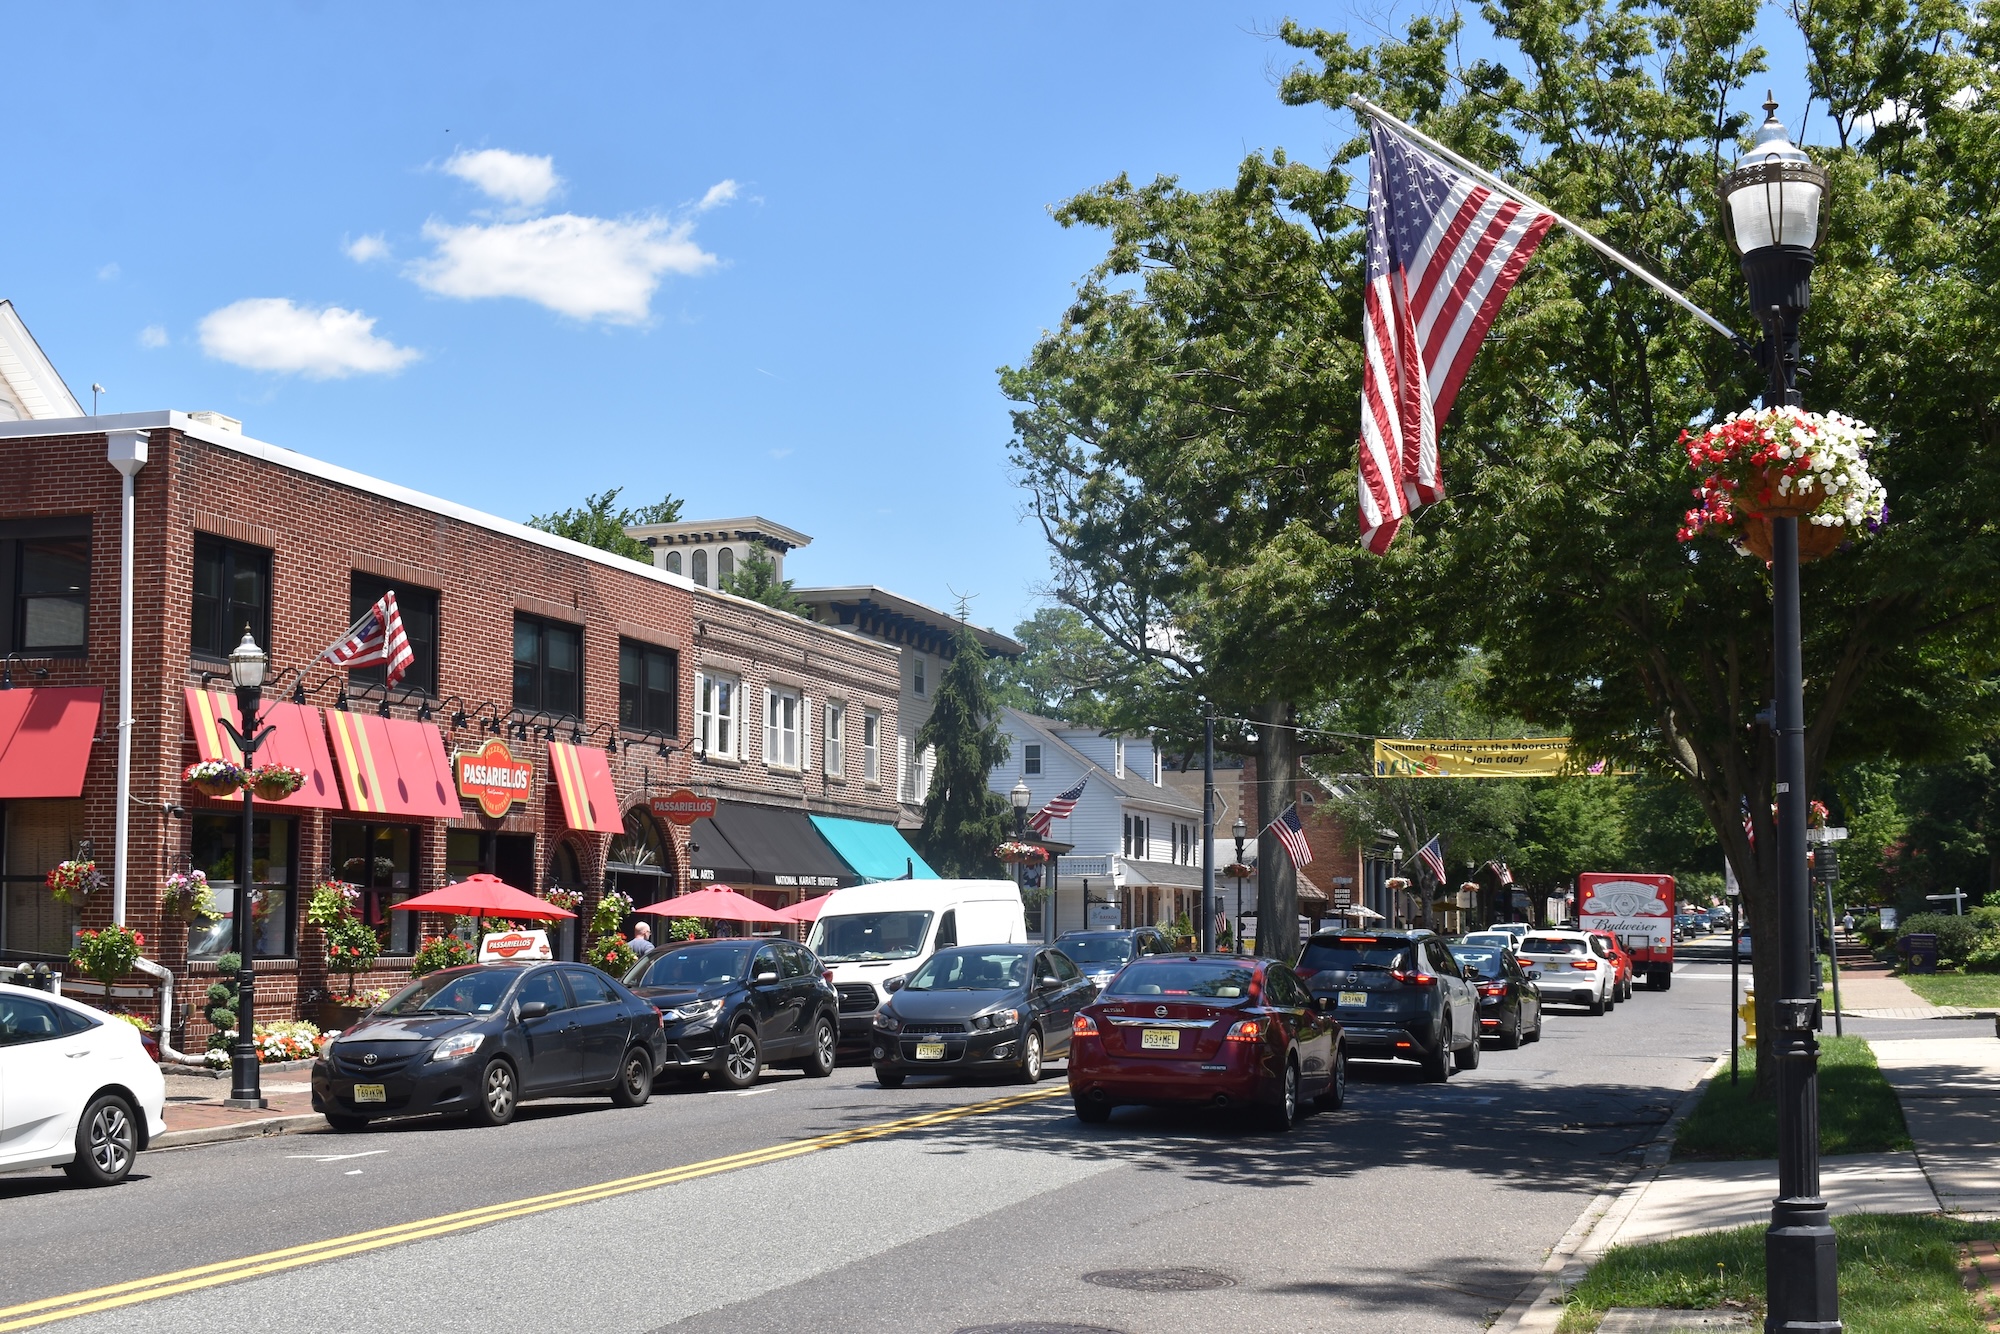
Moorestown, NJ
With comprehensive pavement condition data and a complete drainage asset inventory, Moorestown moved from guesswork to a transparent, defensible program residents can see on the ground.

Moorestown, NJ Infrastructure Assessment
Summary
- Data-driven road program delivered in weeks, bringing safer streets to residents sooner
- 106 roadway miles scanned with LiDAR produced detailed, actionable pavement condition data and clear work plans
- 2,247 catch basins mapped to cut flooding risks, protect pavement, and stretch taxpayer dollars
Problem
Without current, consistent pavement data, Moorestown struggled to know which roads to fix or when, and lacked an up-to-date asset inventory to guide budgeting. As a result, staff were stuck playing defense to resident complaints—constantly asked “Why not my road?” and unable to justify choices in meetings. The absence of reliable, comparable data left the team uncertain, reactive, and under fire, with projects delayed and taxpayer dollars stretched thin.
Solution
Moorestown chose Cyvl to rapidly survey the entire network using vehicle-mounted LiDAR and sensors, scanning 106 roadway miles in weeks instead of months. Through Cyvl’s Infrastructure Intelligence platform, AI converted the raw data into detailed, actionable pavement condition scores, prioritized repair lists, and defensible multi-year plans and reports. Delivered by July 29, 2025, the city received trustworthy, up-to-date pavement condition data for all 106 miles plus a mapped inventory of 2,247 catch basins, enabling faster decisions, clearer budgeting, and quick action for residents.
Impact
With comprehensive pavement condition data and a complete drainage asset inventory, Moorestown moved from guesswork to a transparent, defensible program residents can see on the ground. The city now sequences repairs and preservation work based on objective scores and risk, accelerating visible fixes and reducing time between data collection and construction. Faster data delivery by July 29, 2025 meant plans, budgets, and communications were ready in weeks, helping leadership secure support and schedule work before another season of wear.
- 106 roadway miles scanned and scored, giving crews a clear, street-level playbook to schedule repairs sooner
- Detailed, actionable pavement condition data enabled a comprehensive, defensible paving plan developed in a fraction of the time
- 2,247 catch basins mapped to target cleaning and repairs that reduce flooding, protect pavement, and prevent new potholes
- Weeks-not-months delivery compresses the window from survey to construction, so residents see improvements sooner
- Noticeable reduction in 311 road complaints as work is scheduled proactively and communicated with maps and reports
- Smoother town meetings with objective data that clearly answers “Why not my road?” and shows efficient use of taxpayer dollars
- Budget requests are easier to justify with quantified needs and trade-off scenarios, allowing dollars to go further across the network


-%20logo%20(unpadded).png.png)