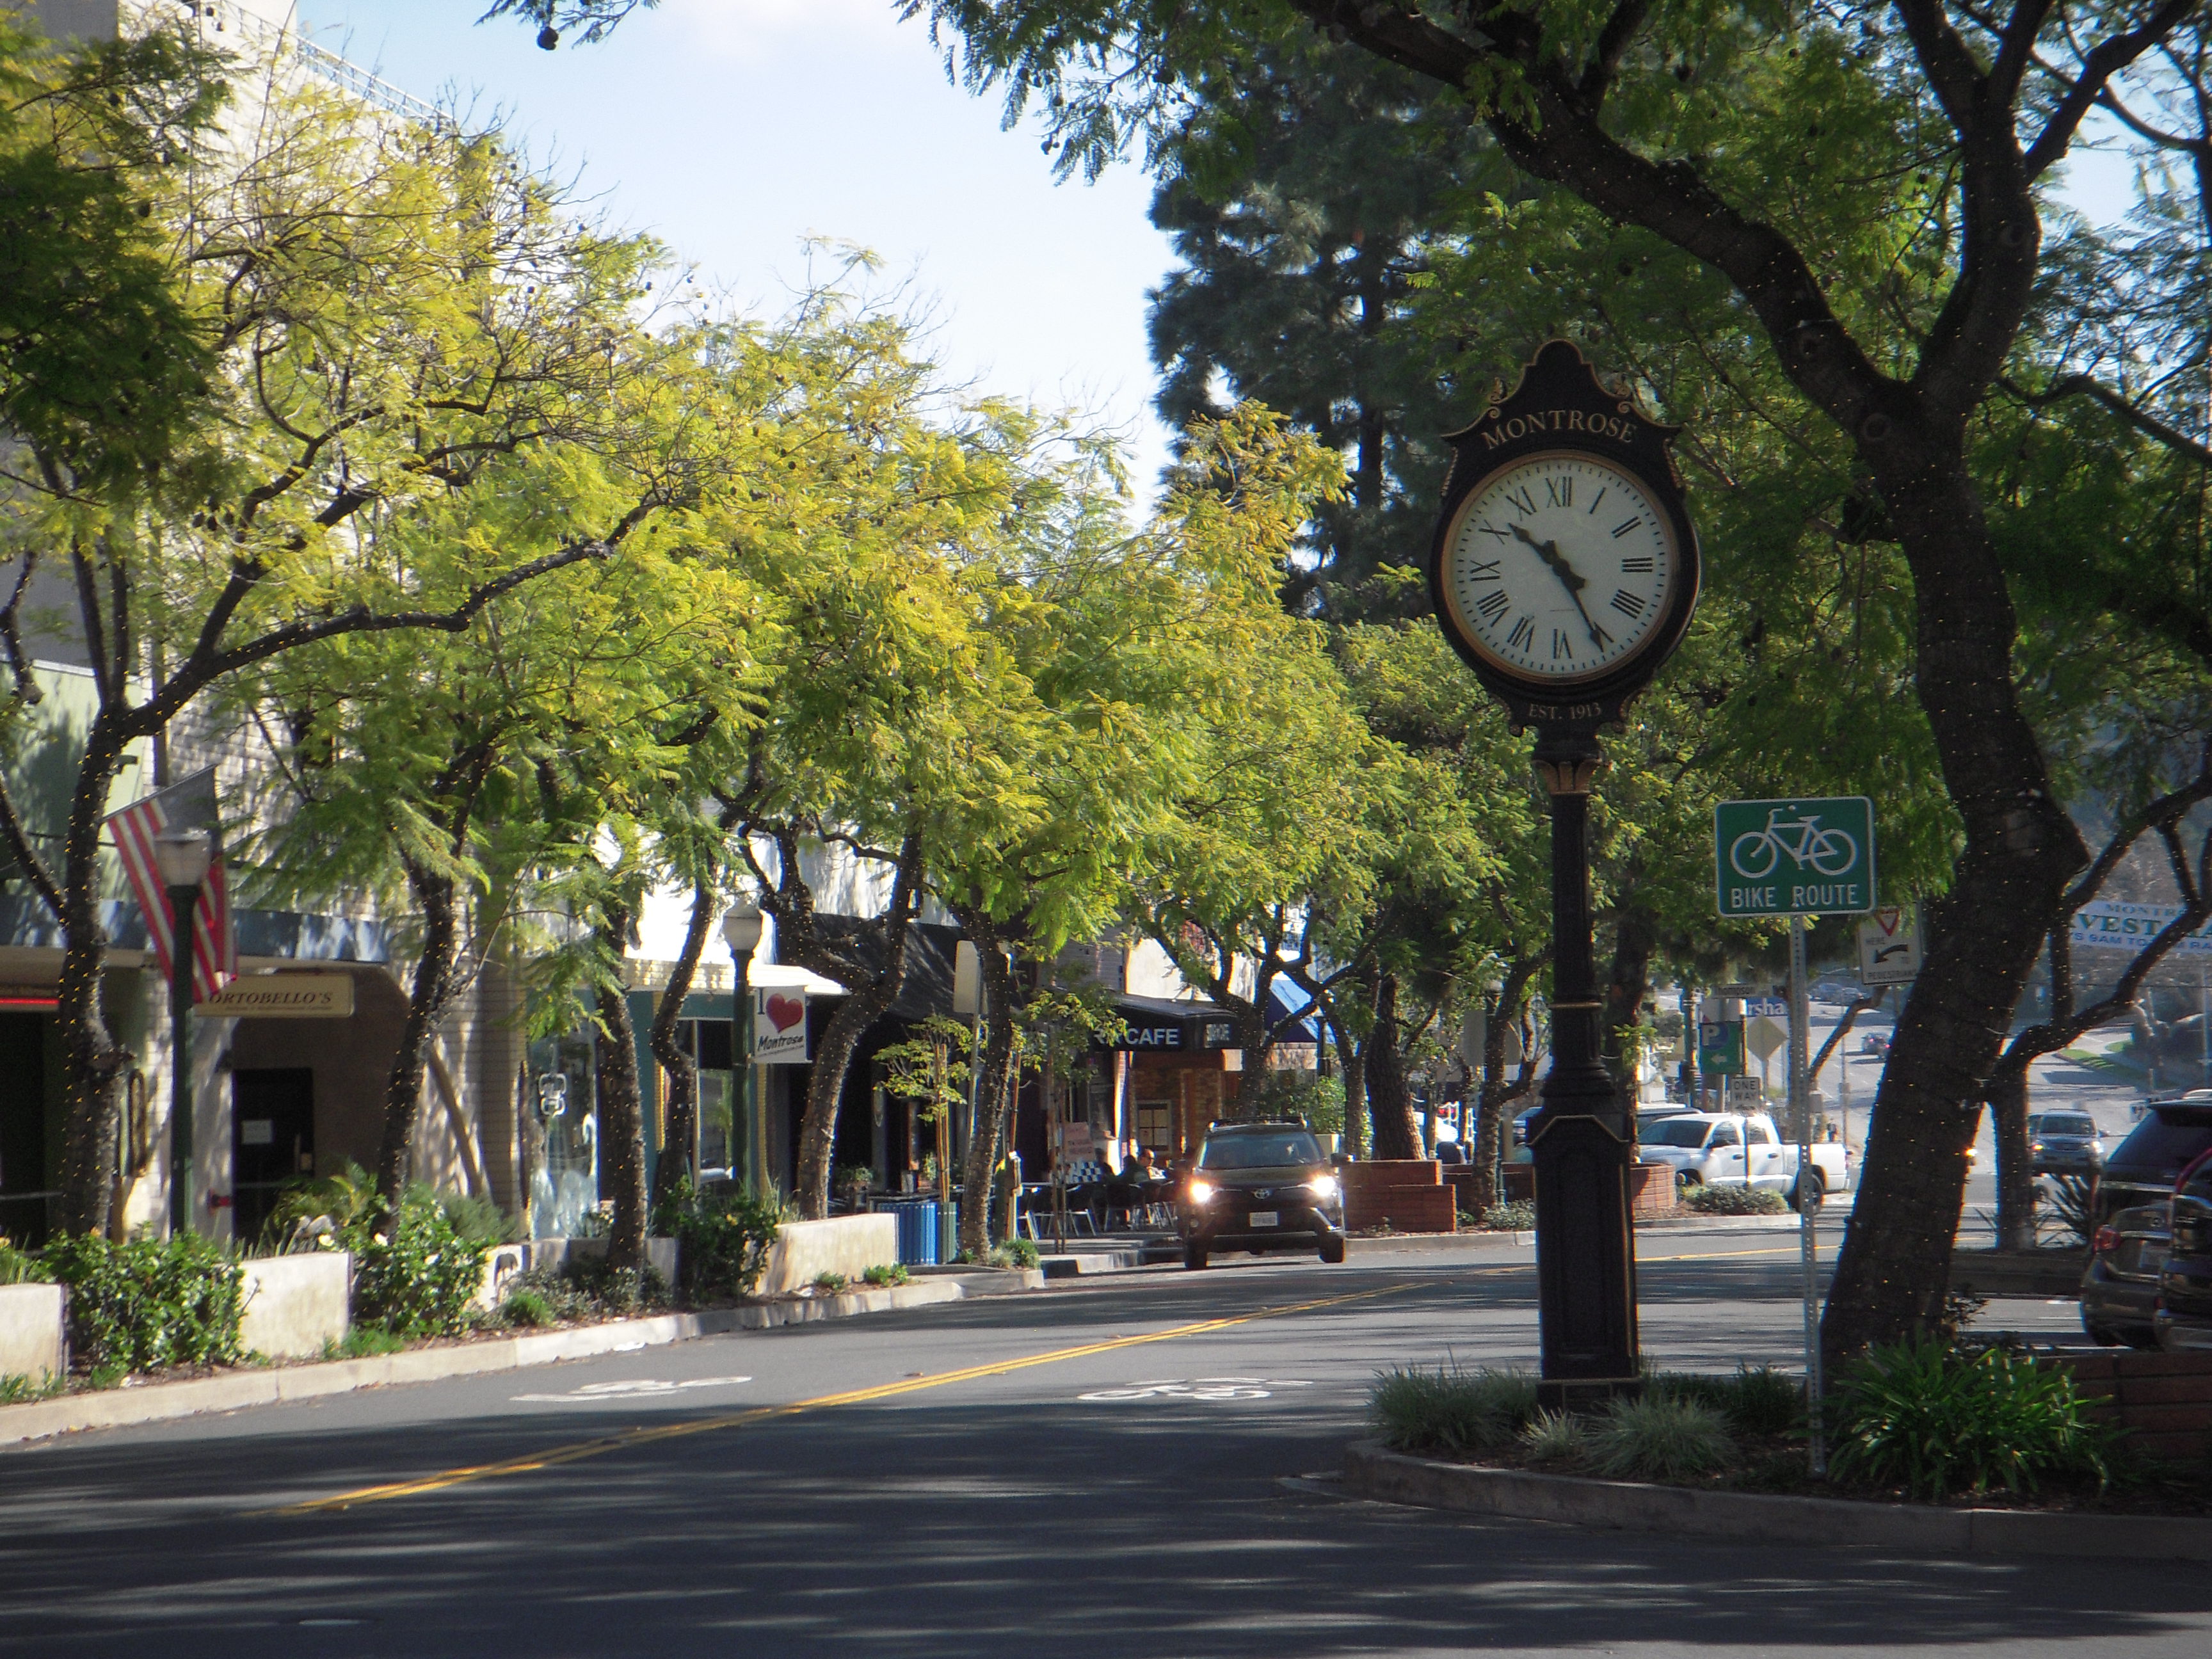
Montrose, CA
With a verified inventory of 277 assets in hand, Montrose accelerated maintenance and safety improvements that residents notice.

Montrose, CA Infrastructure Assessment
Summary
- Fast, citywide inventory of 277 right-of-way assets delivered by November 16, 2023, giving Montrose a clear plan of action residents can see
- 105 traffic signs, 24 street light poles, and 11 traffic signals documented with location and condition for safer intersections and quicker fixes
- Data-driven schedules and capital requests replaced guesswork, accelerating improvements and maximizing taxpayer value
Problem
Montrose’s public works team lacked current, consistent information on signs, curb lines, ramps, and other street-side assets, making it hard to know what to fix, where, and when. Staff often relied on manual spot checks and resident complaints, a reactive model that was slow, inconsistent, and expensive, leaving the city fielding constant “Why not my road?” questions at public meetings. Without trusted data, building defensible work plans and budget requests was difficult, stretching limited resources and pushing routine fixes into emergency mode.
Solution
To change that, Montrose chose Cyvl’s Infrastructure Intelligence approach to rapidly map transportation assets using LiDAR and high-resolution sensors across priority corridors, intersections, and sidewalks. Cyvl’s AI transformed the raw field data into a complete, GIS-ready asset inventory with condition indicators, compliance flags, prioritized repair and replacement lists, and exportable, defensible reports for leadership. The city received results in weeks—by November 16, 2023—so managers could move from reacting to complaints to executing a clear, data-driven plan.
Impact
With a verified inventory of 277 assets in hand, Montrose accelerated maintenance and safety improvements that residents notice. The team now knows exactly where 105 signs, 24 street light poles, 11 traffic signals, 23 curb segments, 16 sidewalk segments, 13 ramps, 18 water valves, 9 pedestrian push buttons, and more are located and what condition they are in, enabling targeted work orders and faster closeouts. Clear maps, photos, and scoring gave leaders confidence to communicate priorities, defend budgets, and schedule crews without delay.
- Weeks-not-months delivery (by November 16, 2023) cut the time from data collection to scheduling, speeding visible improvements for residents
- 105 traffic signs and 11 signals documented with precise locations and condition, improving visibility, crossings, and day-to-day safety
- Fewer 311 complaints and faster responses as crews act on exact asset locations and prioritized work lists
- Budget allocation, public communication, and work scheduling became straightforward with defensible data guiding every decision
- ADA ramps and sidewalk segments flagged for action, reducing trip hazards and improving access for all users
- Institutional knowledge captured in one system, reducing reliance on memory and ensuring continuity when staff changes


-%20logo%20(unpadded).png.png)