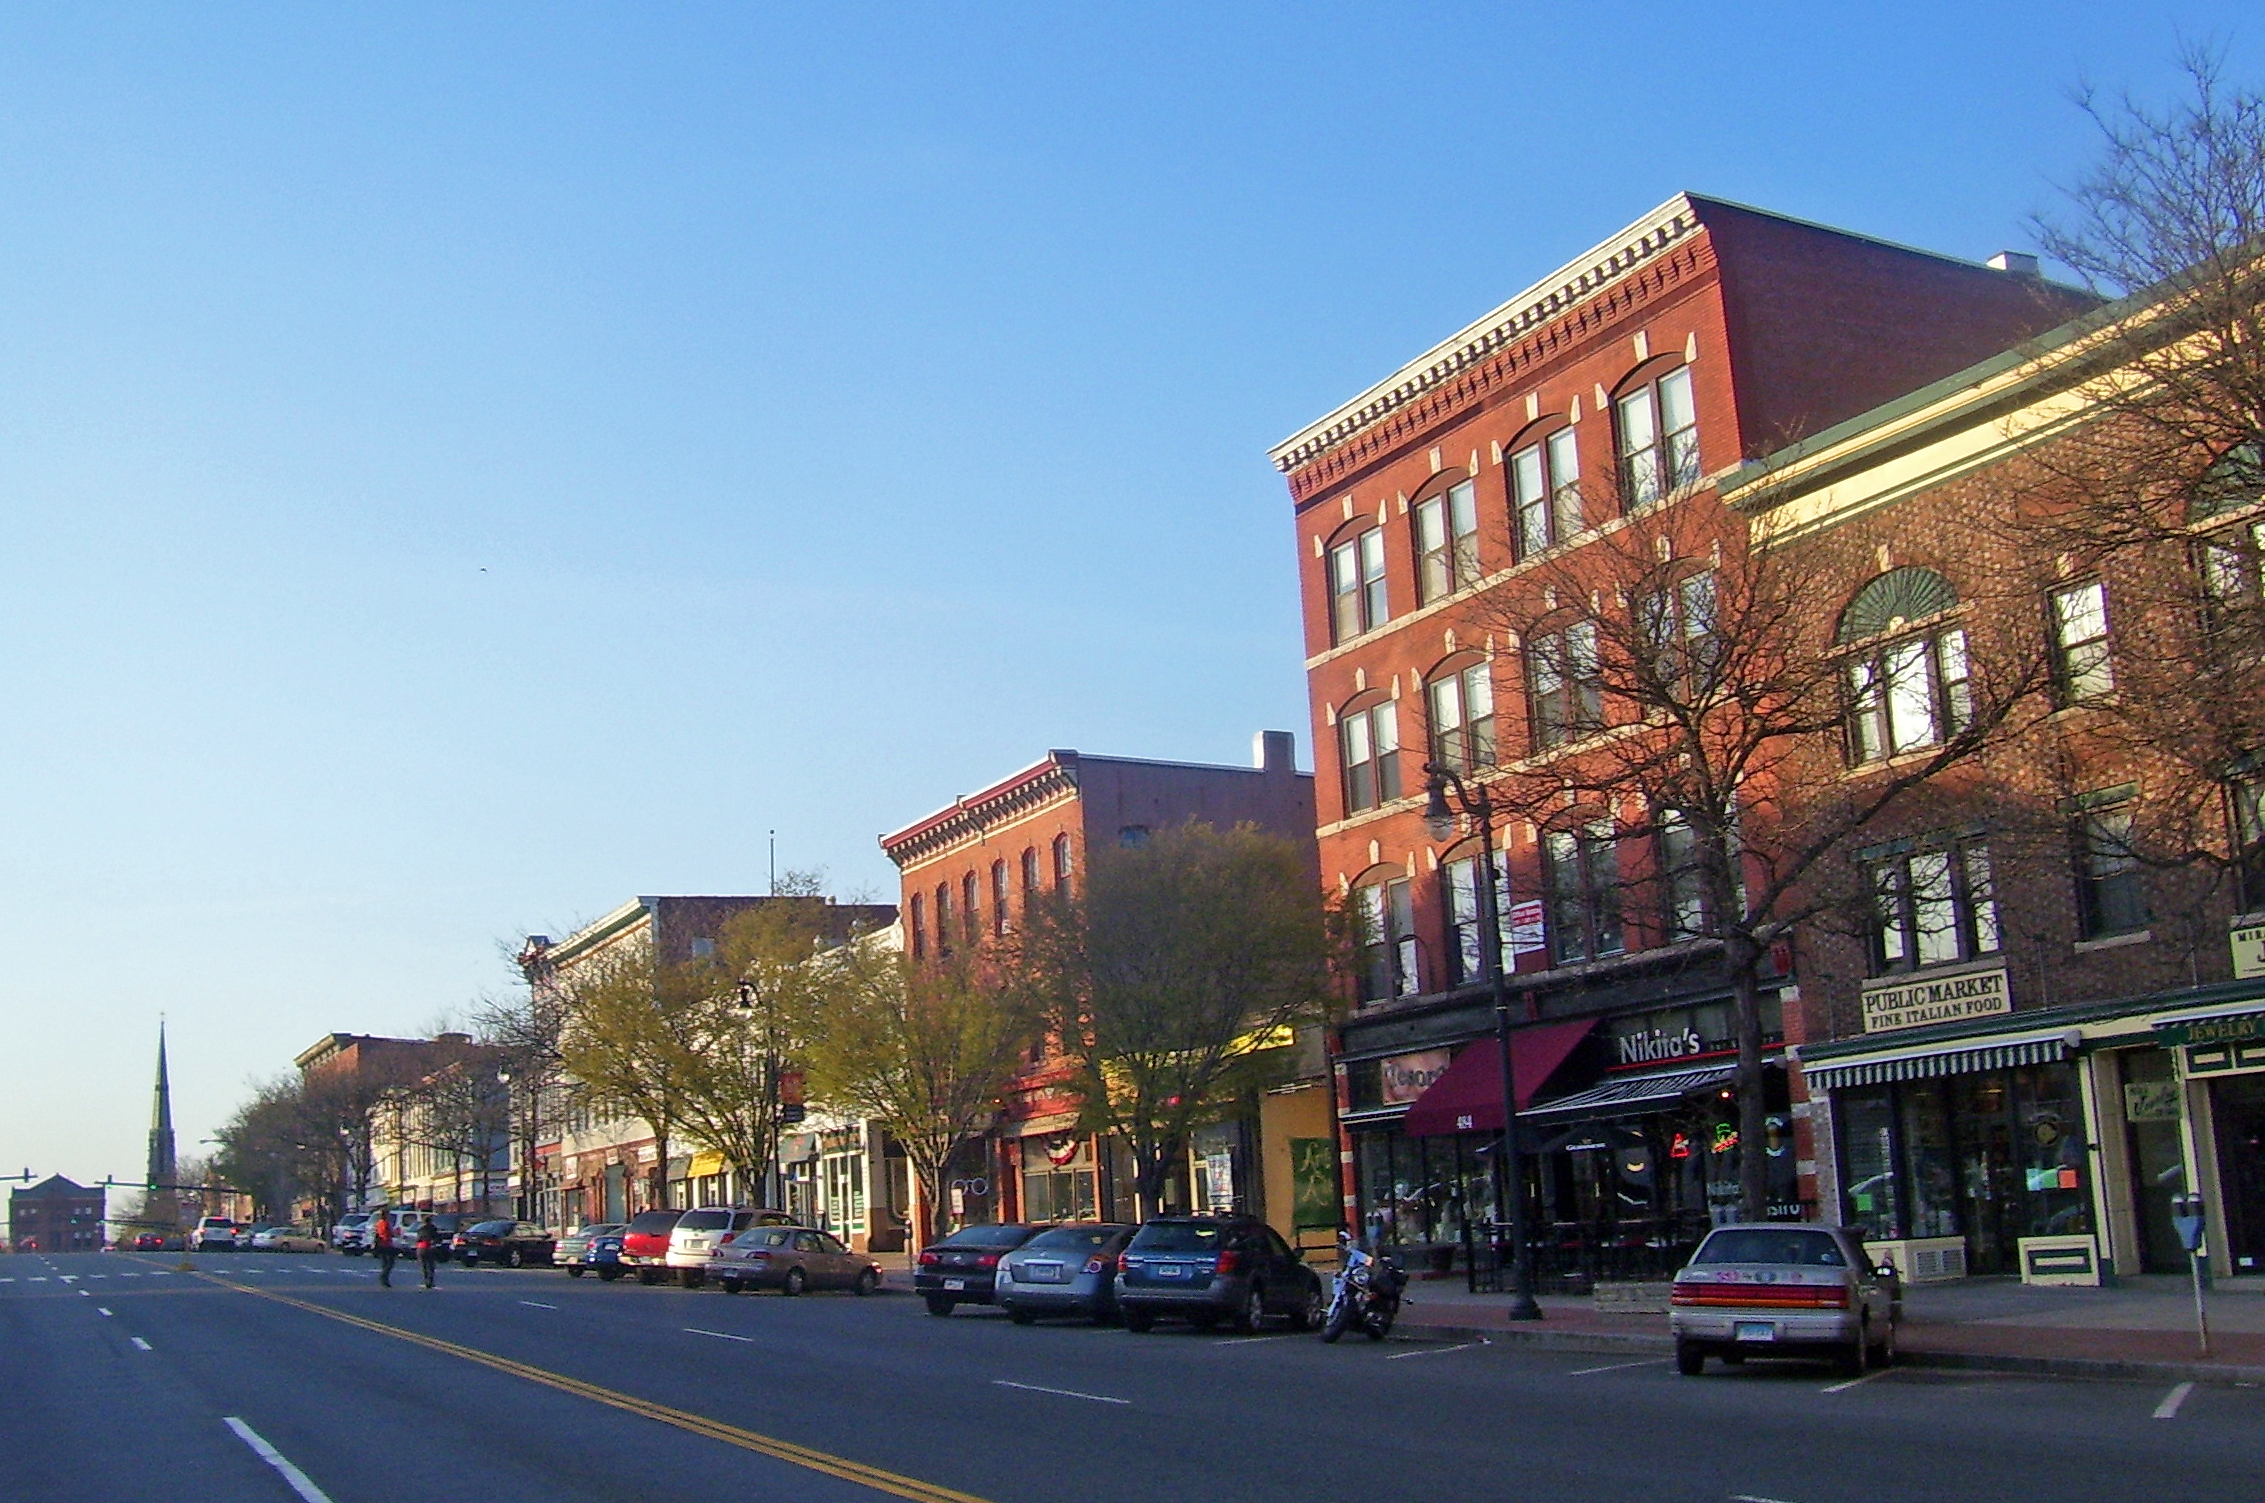
Middletown, CT
In weeks—not months—Middletown shifted from guesswork to a citywide, data‑driven plan delivered on April 22, 2024.

Middletown, CT Infrastructure Assessment
Summary
- 206 roadway miles scanned and 5,286 traffic signs inventoried in weeks, accelerating safer, smoother travel for residents
- Actionable pavement condition scores and prioritized repair lists delivered by April 22, 2024, enabling visible fixes sooner across the city
- Clear, defensible plans that help leaders allocate taxpayer dollars efficiently and explain what gets repaired and when
Problem
Middletown’s road program relied on outdated and inconsistent information, making it difficult to know which streets to fix and when, and preventing accurate paving budgets. Without a clear prioritization method, staff stayed reactive to complaints and faced constant “Why not my road?” questions at town meetings. Manual windshield surveys were slow and unsafe, and by the time reports were assembled, the data was stale—making it hard to defend spending and schedule work with confidence.
Solution
To move from reactive to proactive, Middletown chose Cyvl to capture a complete, objective view of its streets and signs. Using vehicle‑mounted LiDAR and high‑resolution sensors, Cyvl rapidly surveyed 206 roadway miles and inventoried 5,286 signs, then processed the data in the Infrastructure Intelligence platform, which uses AI to turn raw scans into decisions. The city received detailed pavement condition scores, segment‑level analyses, prioritized repair lists, and defensible work plans and reports—so leaders could act faster and communicate clearly with residents.
Impact
In weeks—not months—Middletown shifted from guesswork to a citywide, data‑driven plan delivered on April 22, 2024. With network‑wide pavement condition data and a complete sign inventory, the city scheduled repairs sooner, coordinated crews more efficiently, and reduced disruption to neighborhoods. Residents saw quicker fixes, clearer explanations of what comes next, and stronger budget requests tied to transparent engineering data.
- Safer, smoother commutes as high‑need segments are programmed earlier through a transparent, citywide plan
- Measurable reduction in complaint volume and meeting friction as leaders show objective scores, maps, and upcoming schedules
- Faster pothole and patch response times because crews receive prioritized, GIS‑based work lists directly from the platform
- Budget proposals are easier to defend, backed by 206 miles of condition data and unit‑cost scenarios residents can understand
- More efficient paving seasons with the right treatment at the right time, lowering life‑cycle costs and stretching taxpayer dollars
- Sign safety fixes happen sooner with a living inventory of 5,286 assets, allowing rapid replacement of missing or damaged signs
- Scheduling, funding allocation, and public updates become straightforward with automated reports and construction‑ready segments


-%20logo%20(unpadded).png.png)