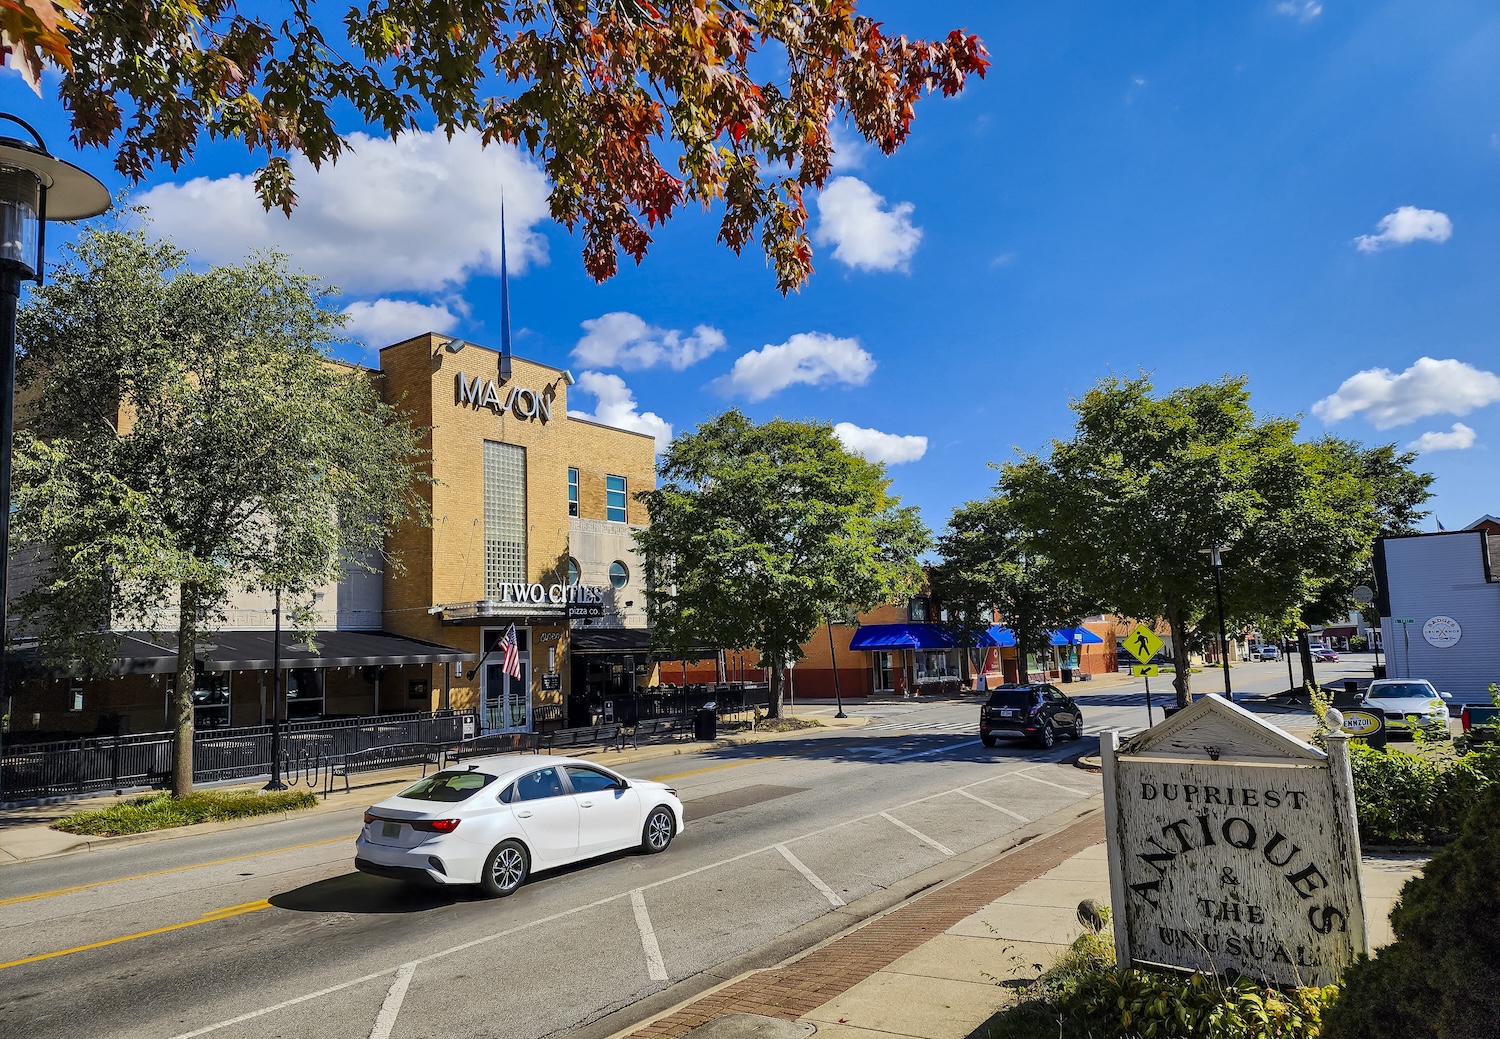
Mason, OH
The City of Mason, Ohio partnered directly with Cyvl to conduct a full-scale inventory of its roadway and right-of-way assets across 190 centerline miles. Facing rapid suburban growth and limited staff capacity, the city needed a faster, more accurate way to assess pavement conditions and document critical infrastructure.
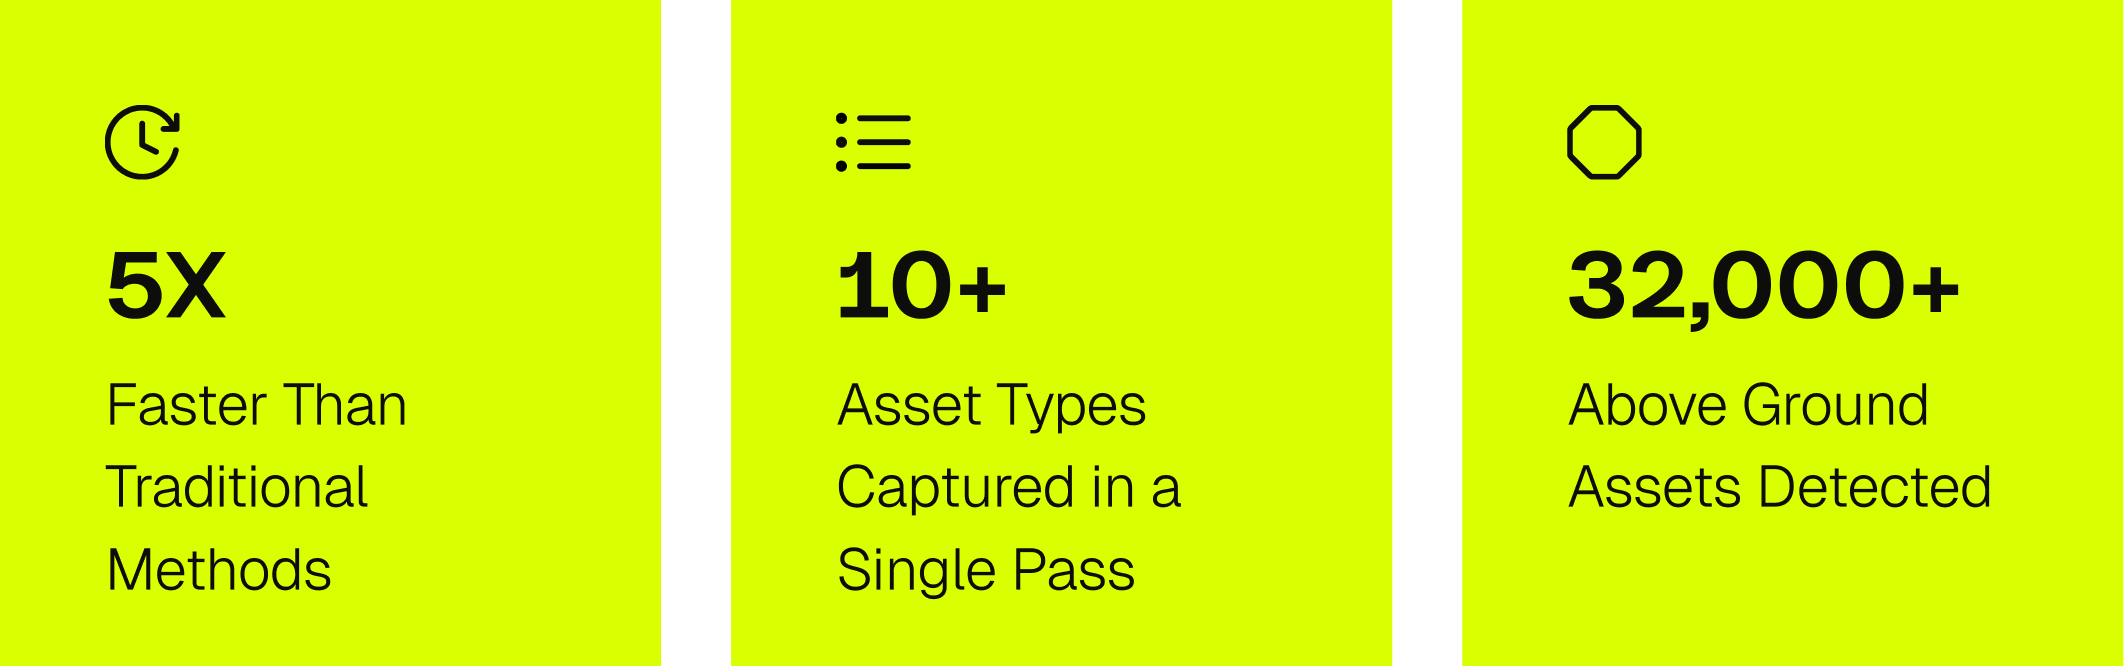
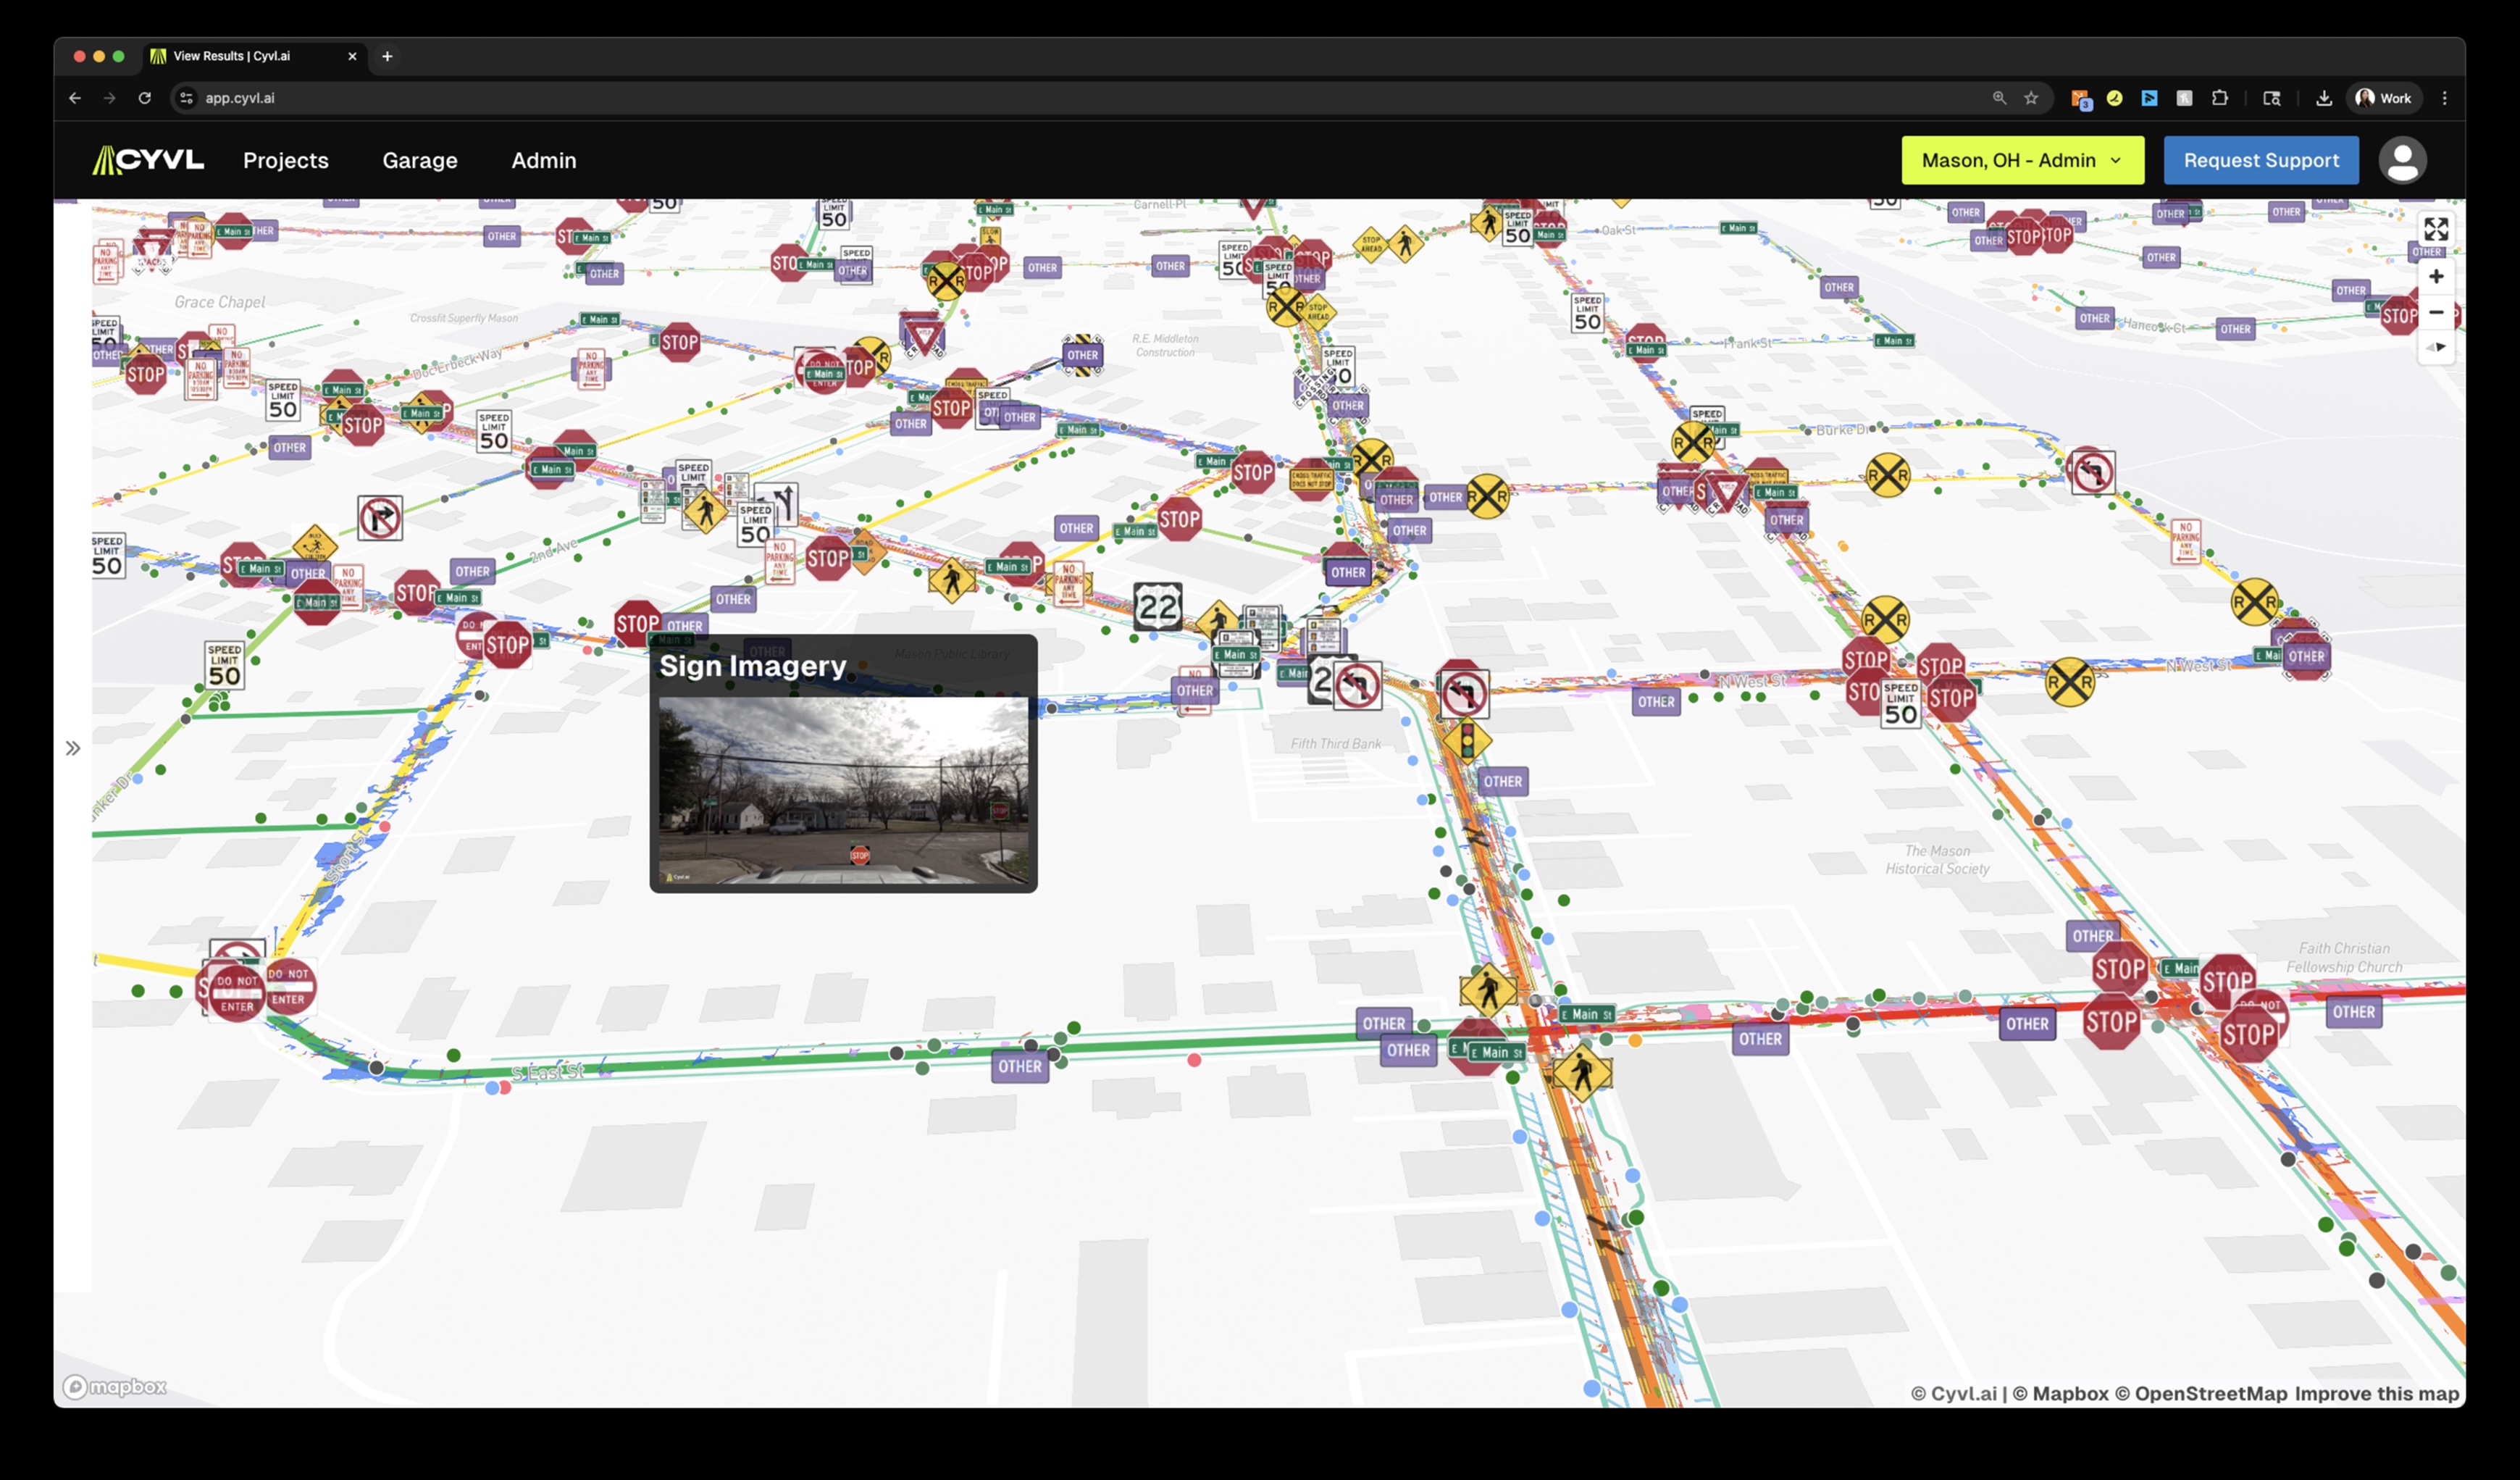
Using Cyvl's self-service scanning system and AI-powered analysis, Mason collected high-resolution imagery, generated pavement scores, and mapped 32,000+ above-ground assets and 8,000+ signs in a single scan. The result: a unified, citywide dataset ready for immediate integration into Mason's GIS and long-term planning efforts.
In Their Words
Assistant City Engineer Nick O. emphasized the speed and value of Cyvl's solution, especially compared the the traditional approaches:
"If you want to know exactly what you have and get it in a very quick amount of time, then this is the way to go. It's super efficient and gets you really close. The 360 imagery was surprisingly useful too. We used it to verify conditions for resident complaints when Google Street View was outdated."
-Nick Okuley, Assistant City Engineer, City of Mason
The Challenge
Mason had previously relied on manual PCI assessments, field inspections, and a patchwork of spreadsheets spread across departments to manage its infrastructure data. Pavements ratings were only updated every two to three years due to time constraints. GIS layers for storm and sanitary sewer systems were outdated, and rapid suburban expansion made it difficult to keep up. The city needed a way to capture everything at once accurately and efficiently
The Solution
Cyvl partnered with Mason to deliver a seamless, city-led data collection effort:
- Shipped a plug-and-play LiDAR and camera scanner to city staff
- Enabled AI-powered pavement condition scoring across all roadways
- Captured high-resolution 2D and 360° imagery of every street
- Inventoried critical assets: streetlights, traffic signals, manholes, inlets, curb ramps, signage, and more
- Delivered fully formatted datasets ready for immediate use in Mason's GIS
Results
1. Centralized Asset Visibility:
- Data from multiple departments was consolidated into a unified, accurate asset inventory, creating a single source of truth as of January 2025.
2. Time Savings & Operational Efficiency:
- Instead of taking months of field work, staff collected the entire city in days, dramatically reducing manual effort and accelerating insights.
3. Unexpected Wins from 360° Imagery
- Street-level imagery helped resolve maintenance complaints and verify field conditions when Google Street View was outdated or unavailible
4. Foundation for Future Asset Management:
- Mason now has the baseline data it needs to integrate with enterprise asset management (EAM) software and scale proactive maintenance strategies.
Impact
This project gave Mason a complete digital view of its infrastructure with minimal disruption and maximum return. in just days, the city captured a level of detail that would have taken mnonths to collect using traditional fieldwork. The result is a comprehensive, citywide inventory of road conditions, and right-of-way assets, all easily accessible and integrated into Mason's GIS.
- Data collection completed in days, not months
- Quicker, more confident service responses
- Clear baseline for future planning and maintenance
By managing the scan internally and partnering directly with Cyvl, Mason avoided the cost and complexity of hiring outside consultants; proving that even fast-growing cities can modernize on their own terms


-%20logo%20(unpadded).png.png)