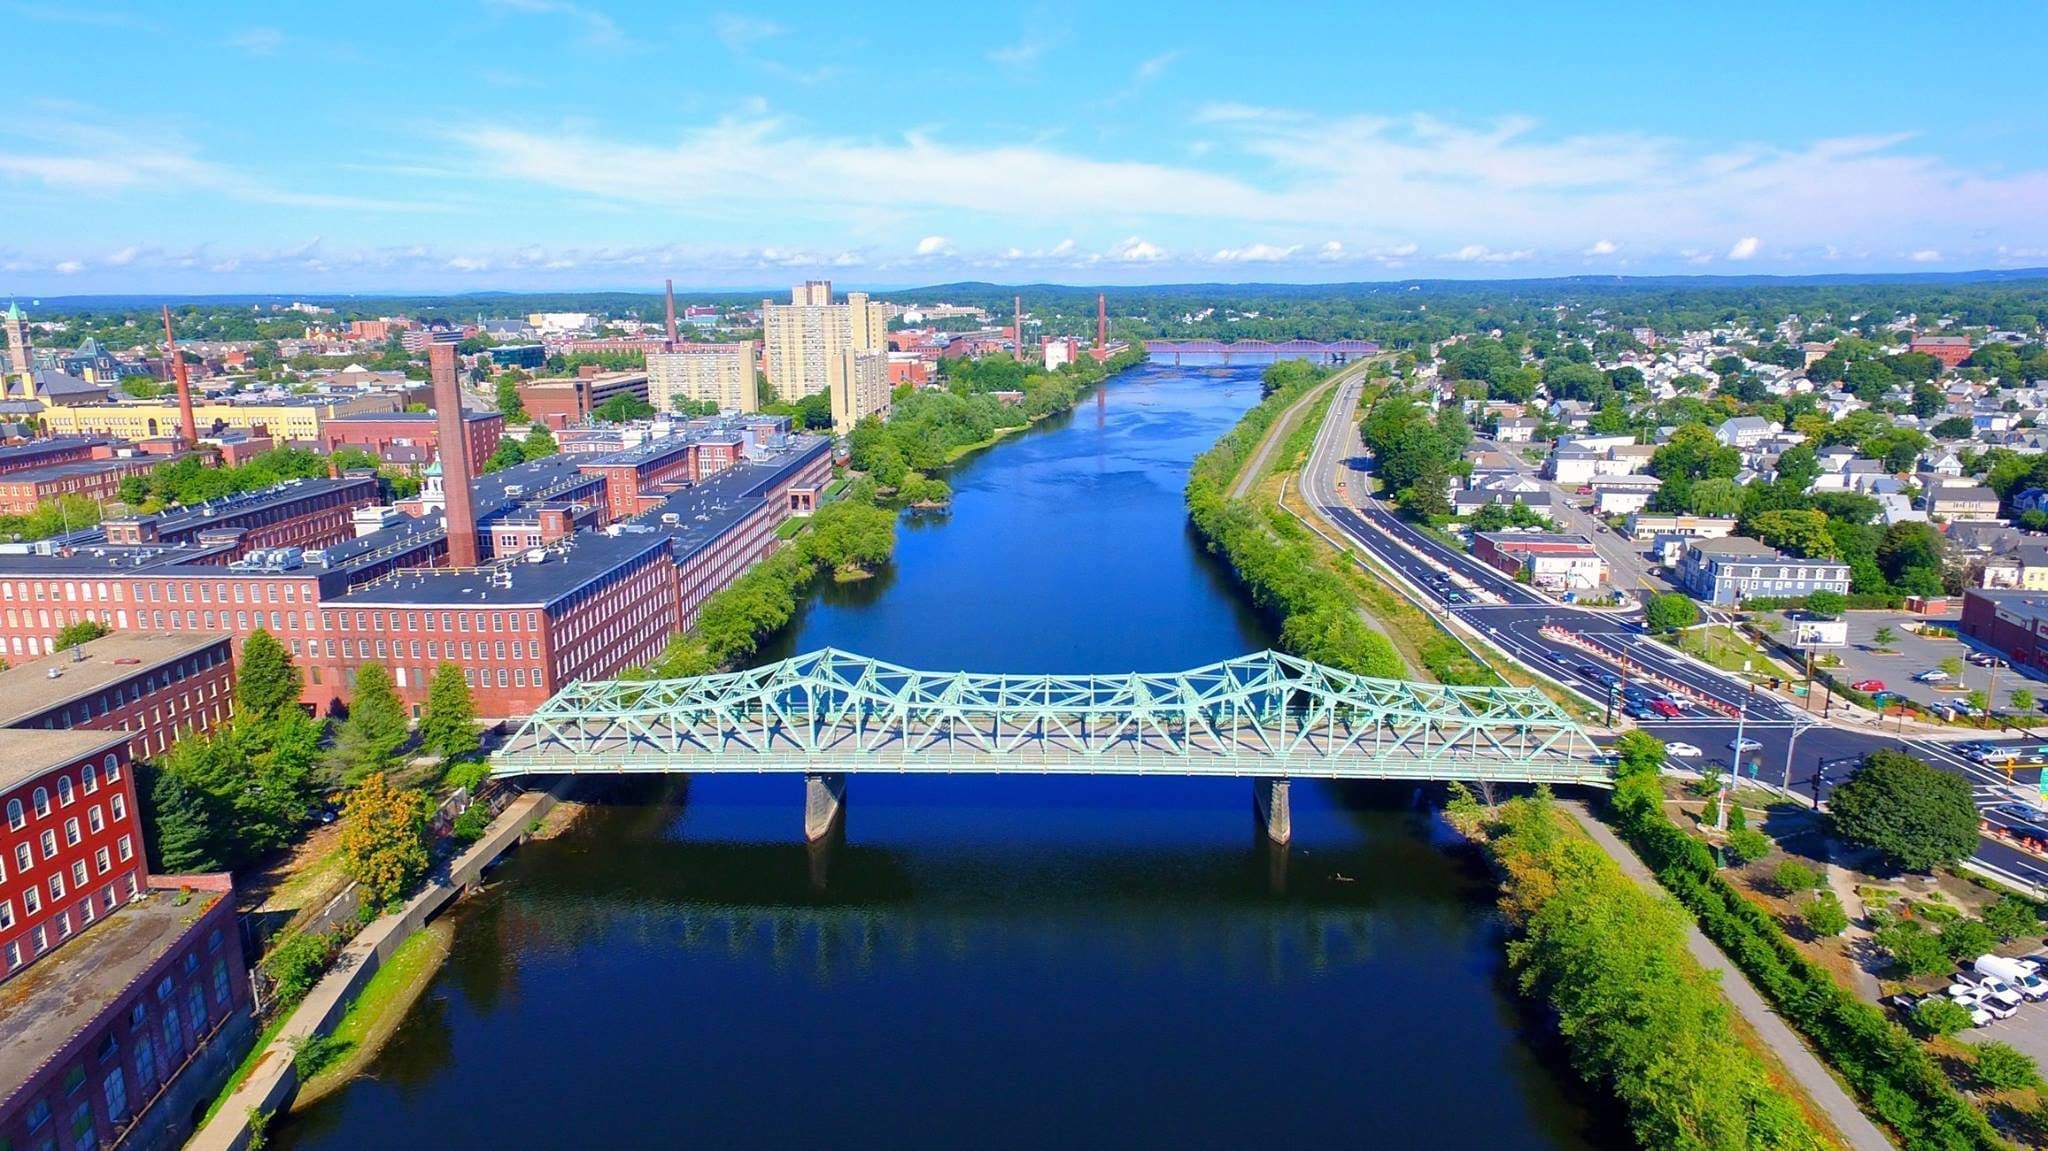
Lowell, MA
Armed with current, consistent pavement intelligence across 236 miles, Lowell aligned engineering, finance, and operations around the same facts and moved from analysis to field work much faster.

Lowell, MA Infrastructure Assessment
Summary
- 236 roadway miles surveyed with LiDAR in weeks, not months, accelerating fixes residents can see
- AI-powered condition scores and prioritized repairs gave Lowell a defensible, citywide paving plan
- Faster budgets, schedules, and communication translated to safer, smoother streets and fewer complaints
Problem
Lowell manages a dense, aging street network where decisions were too often based on outdated or inconsistent data and manual windshield surveys that missed block-by-block differences. Without an accurate citywide inventory and reliable cost baselines, the team struggled to build defensible paving plans and set precise budgets, leading to reactive responses to complaints and worst-first debates at public meetings. These gaps made it hard to show efficient use of taxpayer dollars and kept crews in fire-drill mode instead of executing a strategic program.
Solution
Lowell chose Cyvl to rapidly survey the entire network using vehicle-mounted LiDAR and high-resolution sensors, capturing 236 roadway miles end to end. Within weeks, Cyvl’s Infrastructure Intelligence platform used AI to detect pavement distresses, calculate network- and segment-level condition scores, and generate prioritized preservation and rehabilitation recommendations tied to quantities, unit costs, and schedule windows. By March 26, 2025, the city had detailed, actionable pavement condition data for all surveyed miles plus ready-to-use maps and reports that supported budgets, scheduling, and public communication.
Impact
Armed with current, consistent pavement intelligence across 236 miles, Lowell aligned engineering, finance, and operations around the same facts and moved from analysis to field work much faster. The compressed timeline shrank the gap between data collection and project implementation, so residents see paving, patching, and preservation earlier in the season and fewer emergency repairs later. Clear condition maps and cost scenarios helped leaders answer questions at town halls, defend investments, and target the most critical segments first to improve safety and mobility.
- Segment-level repair lists released within weeks enabled earlier mobilization and faster pothole fixes
- Noticeable reduction in 311 road-condition complaints as issues are addressed before they escalate
- Town meetings run smoother with map-based condition scores that explain "Why not my road?"
- Budget allocation is more efficient; dollars shift to the highest-return treatments, extending pavement life
- Schedules are locked sooner, reducing change orders and letting contractors and city crews plan ahead
- Data-backed narratives support approvals for increased roadway funding and competitive grants
- Transparent reports give residents a clear view of plans and progress, building trust and accountability


-%20logo%20(unpadded).png.png)