Greenwood, IN
In just weeks, Greenwood gained a complete, street-by-street view of pavement health and a verified sign inventory, giving staff the confidence to act.
Greenwood, IN Infrastructure Assessment
Summary
- Weeks, not months: AI-powered street and sign inventory delivered by July 14, 2023, so residents saw faster repairs.
- 28 roadway miles mapped with detailed pavement condition scores to guide transparent, defensible plans.
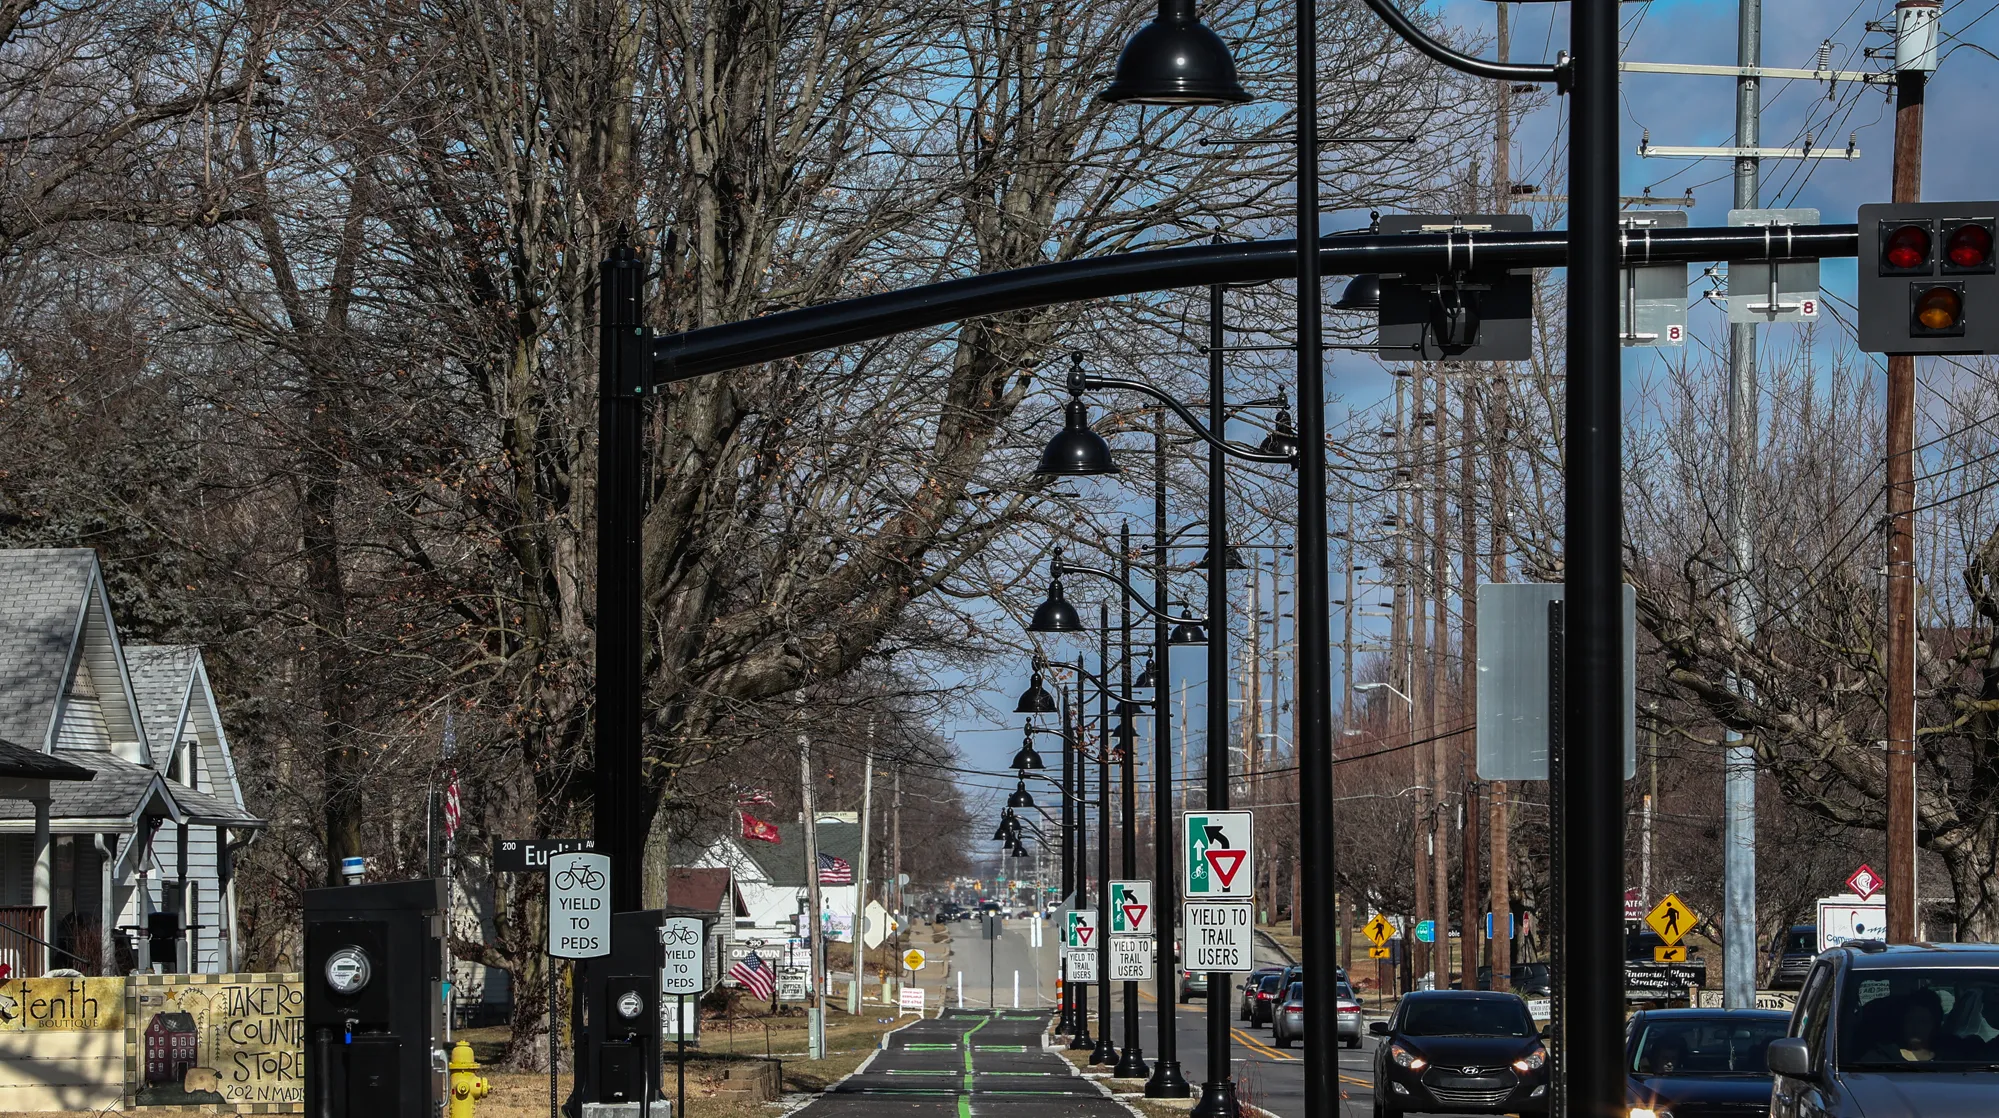
- 1,263 signs inventoried to improve safety, compliance, and daily driving for families.
Problem
Greenwood’s public works team was working from outdated and inconsistent street condition information, making it difficult to know which roads to fix or when and weakening budget estimates. With limited, aging records, staff struggled to answer the constant “Why not my road?” questions and defend choices in council and neighborhood meetings, which fueled 311 complaints. Leaders needed reliable, up-to-date data to make informed decisions and act fast for the community, but manual updates and partial inventories kept the city reactive.
Solution
To move quickly, Greenwood chose Cyvl to perform a rapid, vehicle-based survey using LiDAR and high-resolution sensors across 28 roadway miles, while also inventorying 1,263 traffic signs. The Cyvl Infrastructure Intelligence platform used AI to transform raw data into detailed pavement condition scores, prioritized repair lists, and defensible work plans the city could explain to residents and council. Delivered on July 14, 2023—weeks instead of months—the results equipped leaders with accurate budgets, interactive maps, and reports so they could make better decisions and mobilize crews faster.
Impact
In just weeks, Greenwood gained a complete, street-by-street view of pavement health and a verified sign inventory, giving staff the confidence to act. With clear condition scores and repair priorities, the city scheduled work that targeted the highest-impact segments first and aligned spending with needs residents feel every day. Transparent visuals and numbers improved communication in public meetings and reduced guesswork in budget planning.
- 28 roadway miles scanned with LiDAR and sensors delivered in weeks, accelerating paving and patching timelines residents notice on their daily routes.
- 1,263 signs inventoried and located, improving safety, compliance, and prioritization of replacements at school zones and busy intersections.
- Detailed pavement condition scores and segment-level maps enabled a defensible, citywide plan created in less time, with clear criteria residents can see.
- Faster turnaround from data collection to implementation meant potholes were fixed sooner and resurfacing was scheduled without delays.
- Fewer 311 complaints and smoother town meetings as staff could show objective data behind every “why this road” question.
- Budget requests and allocations grounded in accurate quantities and condition data, allowing taxpayer dollars to be distributed to the highest-impact projects.
- Crew scheduling and contractor bids aligned to prioritized segments, reducing idle time and stretching the paving dollar further.


-%20logo%20(unpadded).png.png)