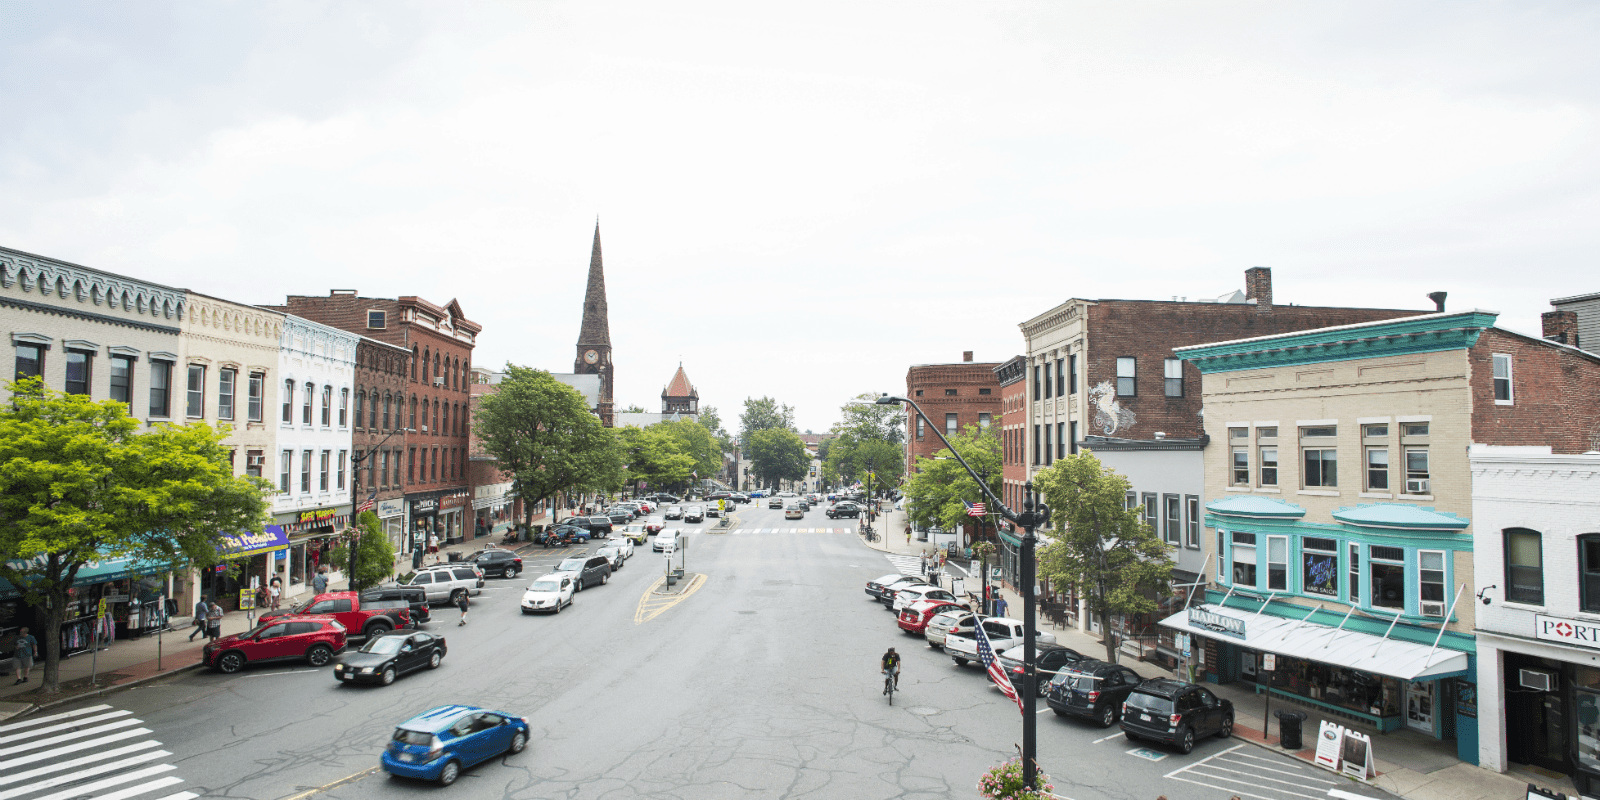
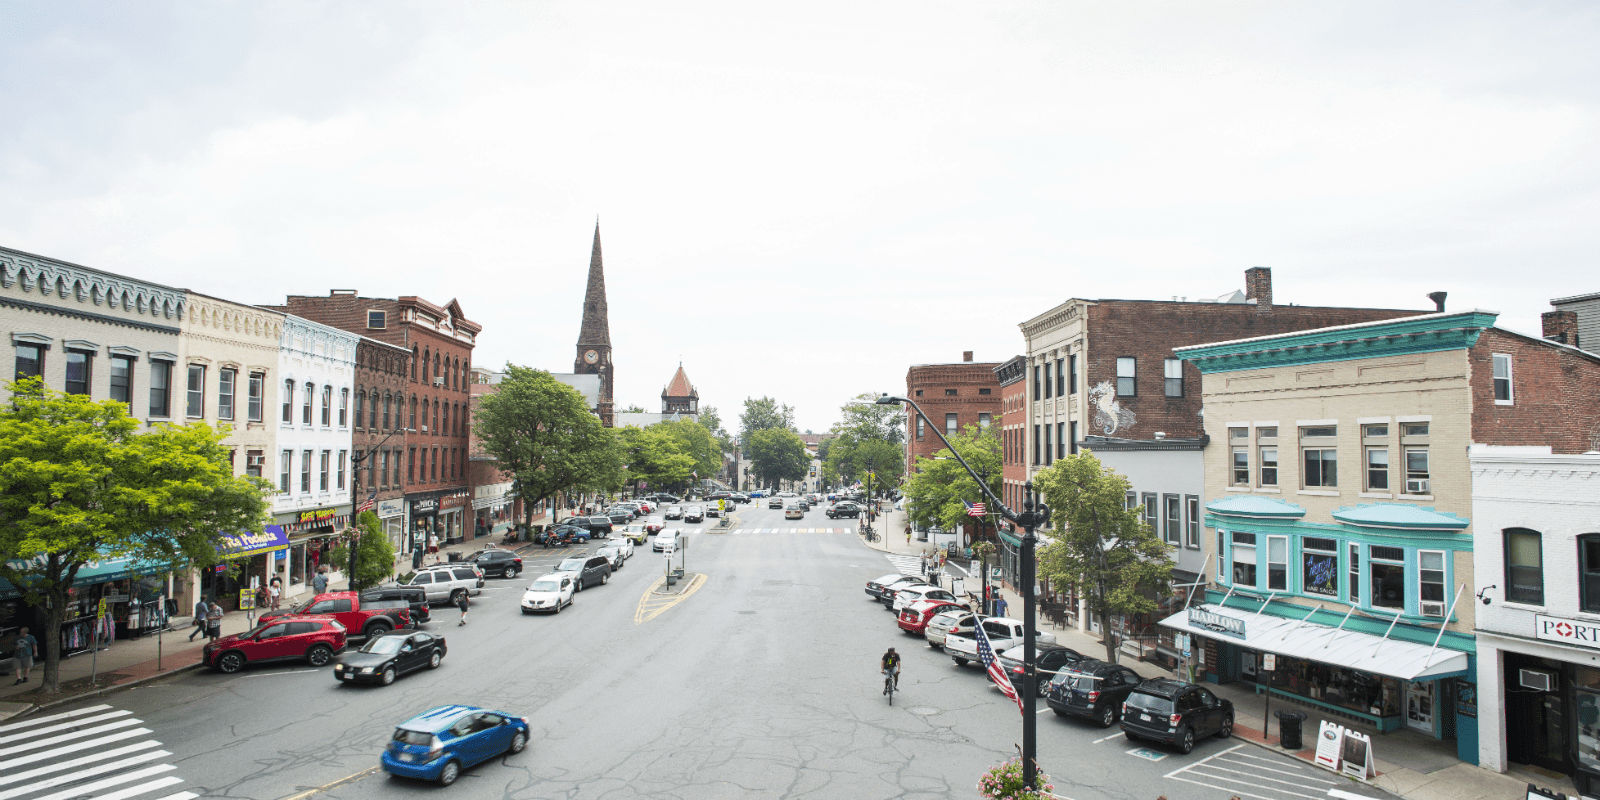
Greenfield, MA
Within weeks of data collection, Greenfield had a citywide baseline and a ready-to-execute work program delivered by May 20, 2025, cutting a months-long planning cycle down to a fraction of the time.

Greenfield, MA Infrastructure Assessment
Summary
- Weeks-to-insight delivery by May 20, 2025 accelerated planning so residents see street and sidewalk fixes sooner
- 107 roadway miles scanned with LiDAR, 5,440 signs inventoried, and 4,998 curb and sidewalk assets mapped to target safety and maintenance residents feel every day
- AI-driven condition scores and defensible plans guide smarter spending and faster, visible improvements across neighborhoods
Problem
Greenfield’s street program relied on outdated or inconsistent data, making it hard to know which roads to fix or when and leaving work plans vulnerable in budget season. Without a clear, defensible prioritization method, staff often had to play defense to resident complaints, reacting to potholes and 311 messages rather than executing a strategic plan. Manual field checks took weeks, so by the time reports were compiled, the information was stale and could not support accurate paving budgets or confident council discussions.
Solution
Greenfield chose Cyvl to rapidly survey 107 roadway miles using vehicle-mounted LiDAR and sensors, delivering authoritative, citywide data by May 20, 2025. Within weeks, the city had detailed, actionable pavement condition data for every block, plus a complete inventory of 5,440 signs and 4,998 curb and sidewalk assets to coordinate roadway and pedestrian improvements. Cyvl’s Infrastructure Intelligence platform used AI to translate the data into condition scores, prioritized repair lists, and scenario-based, defensible plans the city could communicate clearly, enabling leaders to make better decisions and take action faster.
Impact
Within weeks of data collection, Greenfield had a citywide baseline and a ready-to-execute work program delivered by May 20, 2025, cutting a months-long planning cycle down to a fraction of the time. With 107 miles rated and mapped, crews could schedule pavement, curb, and sidewalk repairs in the same window, reducing neighborhood disruptions and the time between community feedback and visible action. Using the 5,440-sign inventory and 4,998 curb and sidewalk assets, the city strengthened funding requests, aligned projects with safety goals, and set clear expectations that residents can track and understand.
- Weeks, not months: authoritative pavement condition scores for 107 miles accelerated paving schedules and reduced time to fix resident-reported issues
- 5,440 signs inventoried enabled quick replacement of missing or damaged signs, improving safety and wayfinding for drivers, cyclists, and pedestrians
- 4,998 curb and sidewalk assets mapped prioritized ADA and trip-hazard repairs, making daily walks safer and more accessible
- Fewer 311 complaints as work orders shifted from reactive patching to proactive, data-informed maintenance across neighborhoods
- Council meetings run smoother with defensible plans, transparent maps, and clear explanations of why projects are scheduled and when
- Budget requests are easier to defend, improving the odds of funding approval and ensuring taxpayer dollars go to the highest-impact projects


-%20logo%20(unpadded).png.png)