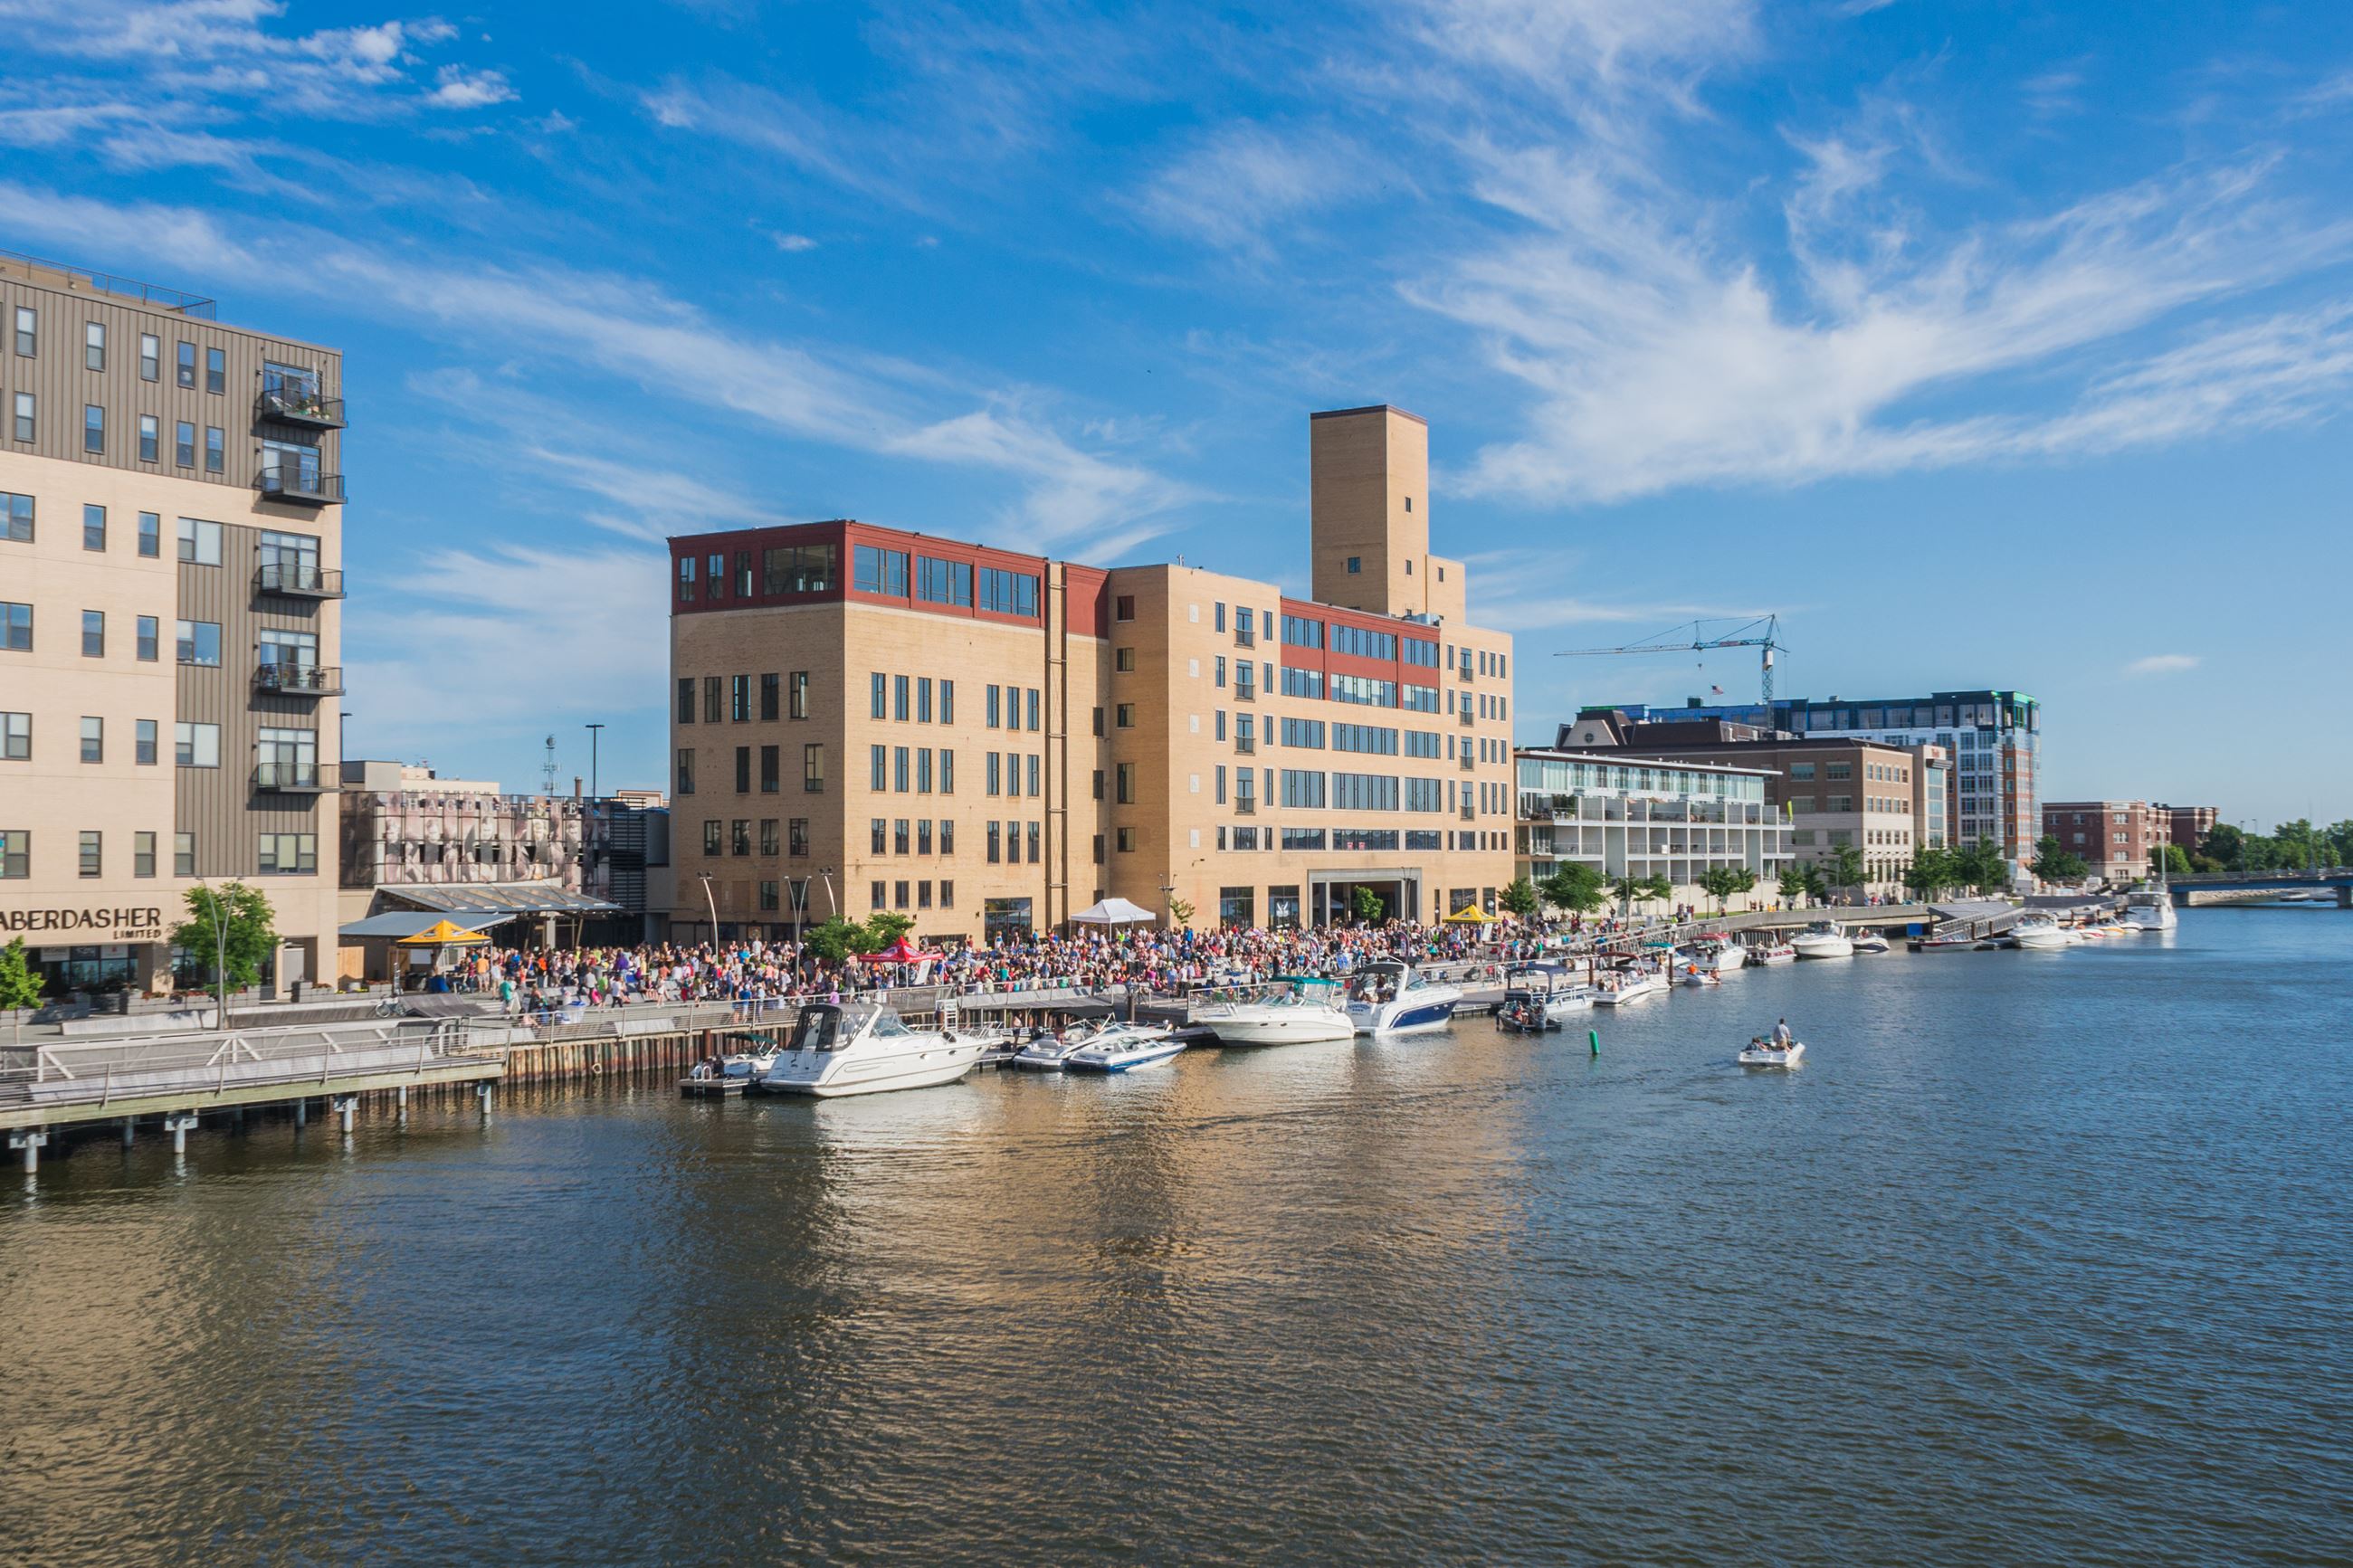
Green Bay, WI
With current, trustworthy data for every block, Green Bay shifted from reacting to complaints to executing a proactive program residents can track.

Green Bay, WI Infrastructure Assessment
Summary
- Full-network pavement condition data for 526 roadway miles delivered to Green Bay on August 6, 2025
- Weeks‑not‑months turnaround enabled faster repairs residents can see sooner
- Data‑driven, defensible paving plan that answers “Why not my road?” in public meetings
- Better use of taxpayer dollars through accurate budgets and targeted maintenance
- Safer, smoother travel with quicker fixes to critical segments and improved scheduling
Problem
Green Bay’s freeze‑thaw winters and heavy truck routes around regional corridors were accelerating pavement distress faster than the city could measure it. Relying on outdated or inconsistent condition data, staff didn’t know which roads to fix or when and struggled to set accurate paving budgets, leaving projects vulnerable to overruns and deferrals. Meanwhile, the team was constantly asked “Why not my road?” and found it hard to justify actions in council meetings as 311 complaints grew and manual windshield surveys were outdated by the time reports were ready.
Solution
Green Bay chose Cyvl to rapidly survey 526 roadway miles using vehicle‑mounted LiDAR and high‑resolution sensors at traffic speed. Within weeks, and by August 6, 2025, the city had detailed, actionable pavement condition data and network‑level PCI scores inside Cyvl’s Infrastructure Intelligence platform. The platform’s AI produced prioritized repair lists, scenario‑based budgets, and defensible multi‑year plans, giving leaders clear reports to make better decisions and act faster.
Impact
With current, trustworthy data for every block, Green Bay shifted from reacting to complaints to executing a proactive program residents can track. Crews scheduled work by corridor and neighborhood, addressing the most critical segments first while preserving good roads to limit future costs and disruptions. The same dataset strengthened budget requests and public communication, making it easy to show efficient use of taxpayer dollars and the timeline for improvements.
- 526 roadway miles scanned with LiDAR and HD sensors delivered a comprehensive, defensible paving program across every ward
- Data delivered on August 6, 2025—weeks faster than traditional studies—cut the delay between assessment and project scheduling
- Potholes and surface defects are fixed faster because crews receive block‑level condition scores and repair recommendations
- Town meetings run smoother with transparent maps and clear answers to “Why not my road?”
- Fewer 311 complaints as residents see a citywide schedule that explains what gets done, when, and why
- Budget allocation, public communication, and work scheduling are now simple and fast with one source of truth
- Funding requests gain credibility with network PCI, backlog estimates, and scenario‑based cost projections tied to taxpayer value


-%20logo%20(unpadded).png.png)