Framingham, MA
The city moved from uncertainty to action as soon as the network-wide dataset arrived in weeks, not months, enabling summer work to start sooner and shortening the time between survey and construction.
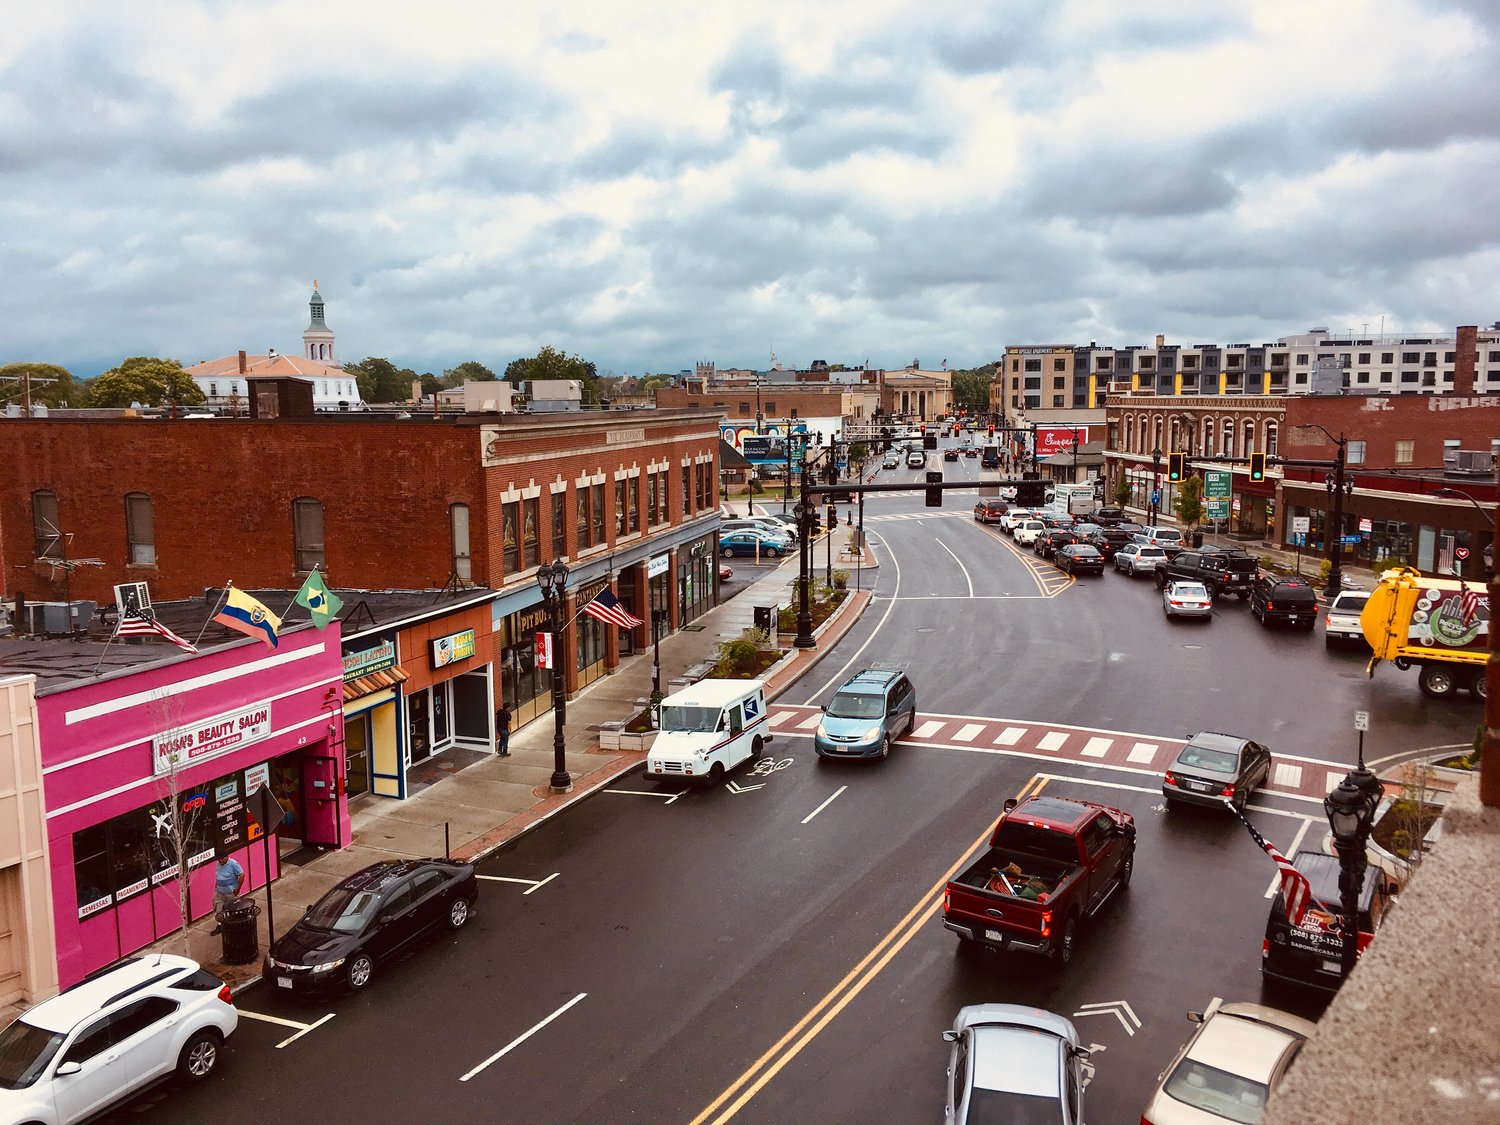
Framingham, MA Infrastructure Assessment
Summary
- 225 roadway miles scanned with LiDAR and sensors; detailed, actionable pavement condition data delivered by May, 17, 2024
- Weeks-not-months turnaround enabled faster fixes, shorter project timelines, and visible improvements for residents
- Data-driven, defensible paving plan improved public communication, trust, and efficient use of taxpayer dollars
Problem
Framingham manages a busy mix of neighborhood streets and regional connectors, but leaders lacked current, consistent pavement data to guide investments, leaving budgets hard to defend and plans difficult to prioritize. With outdated or inconsistent data and no clear prioritization method, staff were often reactive to complaints, drifting toward worst-first choices instead of a strategic network approach. Town meetings were dominated by “Why not my road?” questions, and 311 requests piled up because the city could not easily justify schedules or show progress with confidence.
Solution
Framingham chose Cyvl to rapidly survey 225 roadway miles using vehicle-mounted LiDAR and high-resolution sensors, producing a complete, objective picture of pavement conditions across the network. Cyvl’s Infrastructure Intelligence platform used AI to transform the scans into pavement condition scores, mapped distresses, and GIS-ready layers, then delivered results in weeks, by May, 17, 2024. With these insights, the city generated prioritized repair lists, scenario-based paving plans, and clear, defensible reports—turning raw data into fast, actionable decisions residents could see on the street.
Impact
The city moved from uncertainty to action as soon as the network-wide dataset arrived in weeks, not months, enabling summer work to start sooner and shortening the time between survey and construction. With objective condition scores across 225 miles, staff aligned budgets, balanced preservation and rehabilitation, and scheduled projects where they would deliver the most visible improvements for residents. Transparent maps and reports made town meetings smoother and helped explain the “what, where, and why” of the plan, building trust while accelerating roadwork.
- Faster, safer road improvements as crews launched projects earlier based on complete, defensible data
- Quicker pothole and patch repairs prioritized by objective condition scores and network impact
- Fewer 311 complaints and smoother town meetings thanks to clear maps, schedules, and explanations
- Budget requests and allocations supported by hard data, improving confidence among council and residents
- A comprehensive paving plan built in less time, making work scheduling and coordination extremely easy


-%20logo%20(unpadded).png.png)