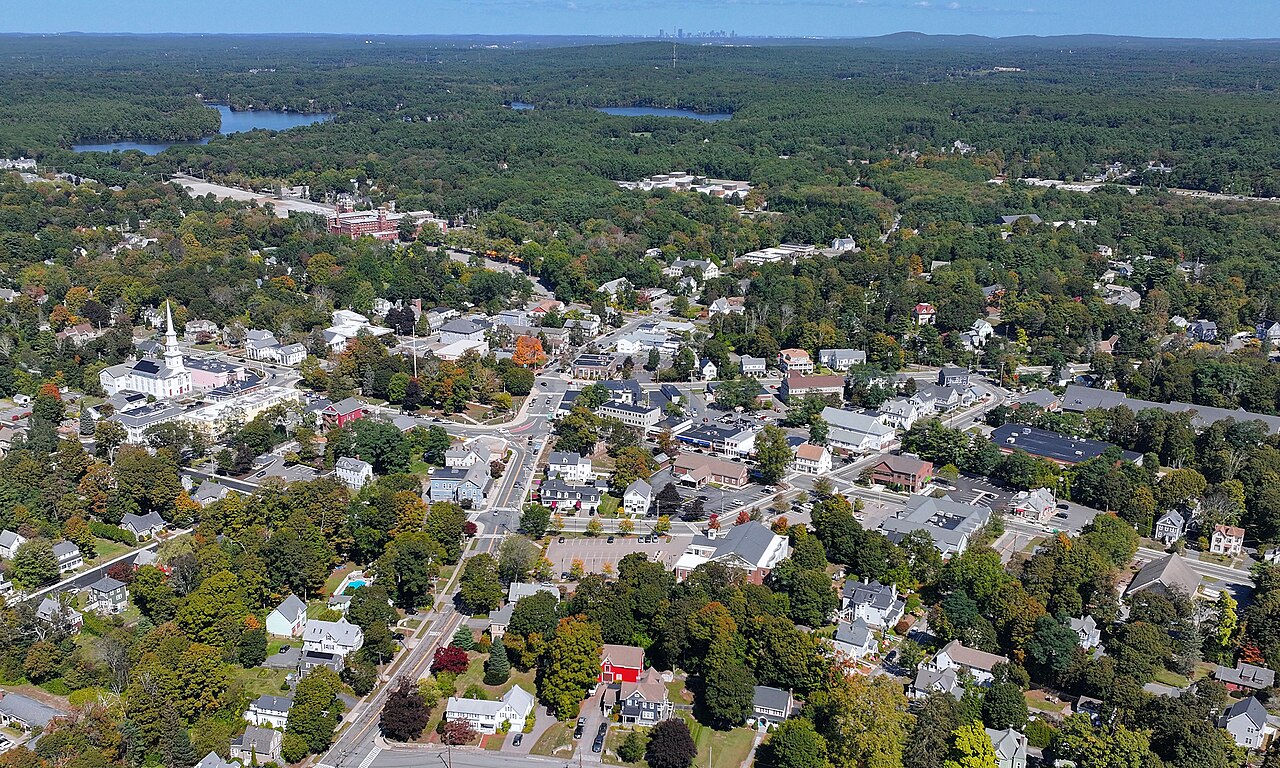
Foxborough, MA
With detailed pavement condition data for all 95 miles and a complete inventory of 2,199 signs, Foxborough moved from reactive fixes to a clear, proactive roadmap that residents can see in action.

Foxborough, MA Infrastructure Assessment
Summary
- Scanned and condition-scored 95 roadway miles in weeks, accelerating visible repairs residents care about
- Inventoried 2,199 signs to improve safety, compliance, and maintenance scheduling across town
- Delivered actionable plans by November 16, 2023, enabling data-driven budgeting, clearer communication, and faster project starts
Problem
Foxborough faced New England freeze–thaw damage and event-driven traffic surges with outdated or inconsistent data, making it hard to know which roads to fix or when. Staff were stuck playing defense to resident complaints, constantly asked “Why not my road?” and struggling to justify actions during public meetings. Without reliable information, paving budgets and schedules were difficult to defend, and crews were forced into reactive work rather than a strategic program residents could trust.
Solution
Foxborough chose to rapidly deploy Cyvl’s LiDAR and sensor-based survey to capture high-resolution data across 95 miles of roadway, producing a consistent, town-wide view in weeks. Using Cyvl’s Infrastructure Intelligence platform, the town unlocked pavement condition scores, prioritized repair lists, and defensible, data-backed plans and reports that support faster, better decisions. The platform’s AI analytics and dashboards translated raw data into actionable, transparent work plans the town could use immediately after delivery on November 16, 2023.
Impact
With detailed pavement condition data for all 95 miles and a complete inventory of 2,199 signs, Foxborough moved from reactive fixes to a clear, proactive roadmap that residents can see in action. The short turnaround—from data collection to delivery in weeks—compressed planning time so crews could schedule work sooner, coordinate with utilities, and minimize disruption. Transparent maps, scores, and reports improved public understanding, helping leaders explain priorities and demonstrate efficient use of taxpayer dollars.
- 95 roadway miles scanned and condition-scored with LiDAR and sensors, enabling faster, safer repairs residents feel on their daily drives
- 2,199 signs inventoried to improve safety, visibility, and maintenance cycles, reducing confusion at key intersections and school zones
- Weeks-not-months data delivery by November 16, 2023, so projects could move from planning to implementation without delay
- Fewer 311 complaints as proactive repairs and clear prioritization replaced reactive, ad-hoc responses
- Budget requests and allocations backed by quantified needs, improving confidence with the council and taxpayers
- Town meetings run smoother with maps and scorecards that explain what gets fixed, when, and why
- Crews schedule work by impact and timing, coordinating paving with utility work to reduce rework, waste, and resident disruption


-%20logo%20(unpadded).png.png)