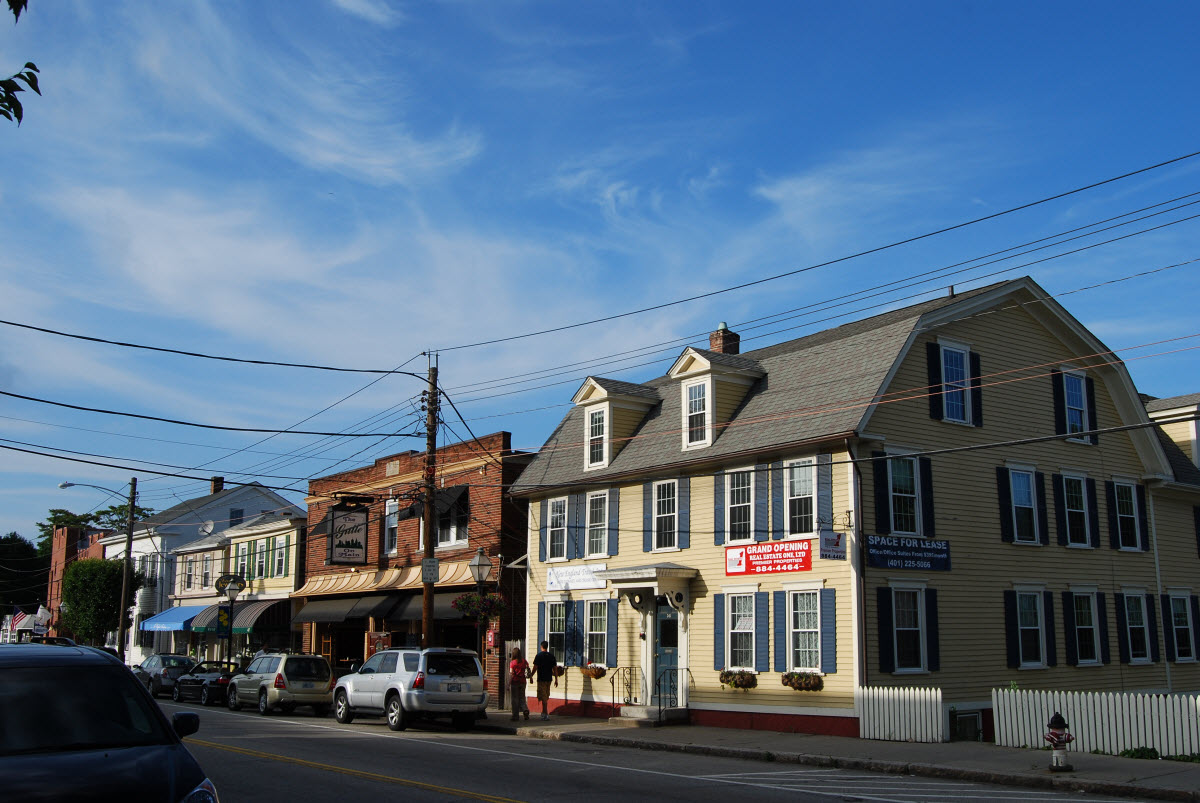
East Greenwich, RI
By June 7, 2024, East Greenwich had current, trustworthy pavement intelligence—weeks faster than a traditional study—so work could be scheduled in the same construction season.

East Greenwich, RI Infrastructure Assessment
Summary
- 94 roadway miles scanned with LiDAR and sensors, delivered by June 7, 2024, turning months of waiting into weeks and accelerating visible repairs for residents
- Detailed, actionable pavement condition scores and prioritized repair lists enabled a defensible, faster plan
- Clear data streamlined council communications and reduced 311 friction, improving safety on school and commuter routes
- Efficient budgeting and scheduling focused resources where they would help residents most, sooner
Problem
East Greenwich, RI faced growing pavement wear from New England freeze–thaw cycles and steady traffic to schools, downtown, and the waterfront. The town relied on outdated or inconsistent information, so leaders didn’t know which roads to fix or when and struggled to defend paving budgets with confidence. At public meetings, staff often had to play defense to resident complaints—fielding “Why not my road?” questions without a clear, transparent prioritization backed by current data.
Solution
To move quickly, East Greenwich chose Cyvl to survey the entire network with vehicle‑mounted LiDAR and sensors, capturing objective pavement data across 94 roadway miles in a matter of weeks. Cyvl’s Infrastructure Intelligence platform used AI to convert raw data into block‑by‑block condition scores, recommended treatments, and cost‑informed, prioritized project lists. The result was a transparent, defensible plan and ready‑to‑use reports that helped leaders make better decisions faster and communicate them clearly to the community.
Impact
By June 7, 2024, East Greenwich had current, trustworthy pavement intelligence—weeks faster than a traditional study—so work could be scheduled in the same construction season. The city gained detailed, actionable pavement condition data for all 94 miles, enabling confident budgeting, quicker design scoping, and faster procurement. Residents benefited from a shorter wait between data collection and repairs, safer routes, and clearer answers about how and why projects were prioritized.
- 94 roadway miles surveyed with LiDAR and sensors, with maps and condition scores delivered by June 7, 2024, accelerating fixes residents can see
- Crews scheduled resurfacing, mill-and-overlay, and patching sooner, shrinking the gap from data to construction
- Faster pothole response and safer travel on routes to schools, neighborhoods, and downtown
- Town meetings ran smoother with clear maps, objective scores, and a transparent rationale for project sequencing
- Public works justified funding and aligned budgets to the highest‑need segments, maximizing taxpayer value
- Work planning, communications, and scheduling moved to a single source of truth, reducing 311 churn and saving staff time


-%20logo%20(unpadded).png.png)