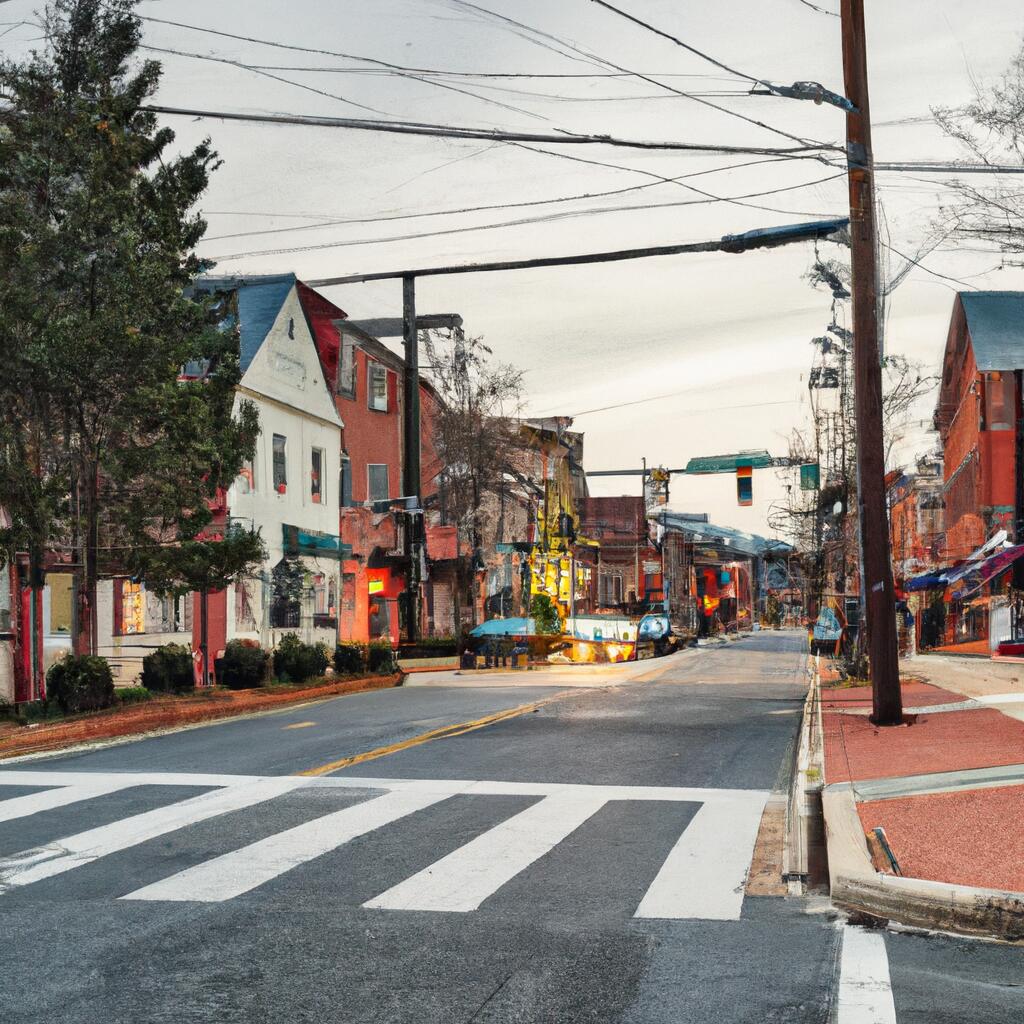
Burlington, NJ
By September 2024, Burlington had citywide, actionable pavement condition data for 37 miles—delivered in weeks instead of months—so improvements could start sooner.

Burlington, NJ Infrastructure Assessment
Summary
- 37 roadway miles scanned and full pavement and asset dataset delivered by September 11, 2024—weeks, not months
- 2,606 signs inventoried and 2,407 assets mapped to improve safety, lighting, and tree coordination for residents
- AI-powered condition scores and repair plans turned reactive fixes into proactive, data-driven action that residents can see on the street
Problem
Burlington needed a clear picture of its network, but leaders were working with outdated and inconsistent data that made it hard to see where pavement and street assets were failing. Without defensible, network-wide information, crews often reacted to complaints and the latest 311 calls instead of following a transparent plan. This put staff on defense at public meetings—answering “Why not my road?”—and made it difficult to forecast budgets and show efficient use of taxpayer dollars.
Solution
Burlington chose Cyvl to rapidly build a current, shared baseline of street conditions and assets across the entire city. Using vehicle-mounted LiDAR and sensors, Cyvl scanned 37 roadway miles and inventoried 2,606 signs while mapping 2,407 additional assets—1,281 trees, 1,110 street lights, and 16 treelines—with results delivered by September 11, 2024. Cyvl’s Infrastructure Intelligence platform applied AI to convert the raw data into detailed pavement condition scores, prioritized repair lists, and defensible multi-year plans, enabling city leaders to make better decisions and act faster with clear, public-facing reports.
Impact
By September 11, 2024, Burlington had citywide, actionable pavement condition data for 37 miles—delivered in weeks instead of months—so improvements could start sooner. The combination of condition scores, ranked project lists, and asset maps lets staff schedule work logically, reduce return trips, and coordinate paving with sign, lighting, and tree maintenance. With 2,606 signs and 2,407 mapped assets documented, the city can answer resident questions, defend budgets, and direct crews to the right block at the right time.
- Safer everyday travel as high-severity pavement defects and critical sign issues are addressed quickly using clear priorities
- Fewer 311 complaints and faster closeout of service requests as crews know exactly where to go and what to fix
- Smoother council and town-hall meetings backed by maps, condition scores, and data-driven rationale residents can understand
- More efficient allocation of taxpayer dollars, with budget requests and plans tied to measurable network needs
- Work scheduling becomes straightforward—crews batch repairs by corridor and coordinate with lighting and tree work to reduce disruptions
- Shorter time from data collection to construction, getting repaving and maintenance on the street weeks sooner


-%20logo%20(unpadded).png.png)