Bethany Beach, DE
Within weeks, Bethany Beach received a complete, defensible picture of roadway conditions and assets—on time by June 16, 2025—so crews could move from assessment to action without waiting months.
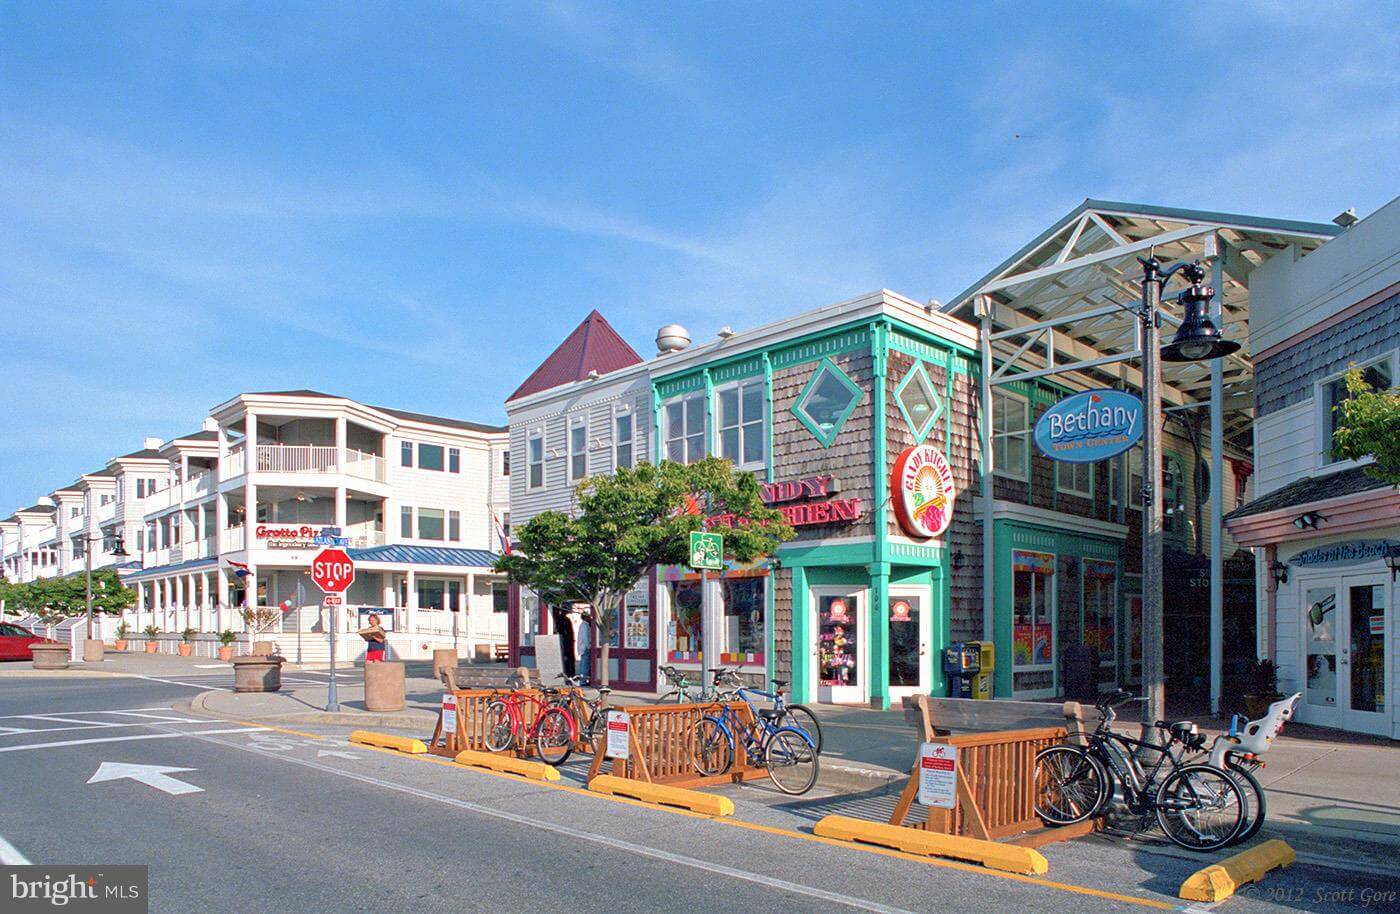
Bethany Beach, DE Infrastructure Assessment
Summary
- 25 roadway miles scanned and full pavement condition scores delivered by June 16, 2025
- 6,930 assets mapped, including 2,191 signs, to speed safety improvements for residents
- Data-driven paving and maintenance plan built in weeks, reducing 311 complaints and boosting confidence at town meetings
Problem
Bethany Beach faced rapid wear from coastal weather and seasonal traffic, but leaders lacked reliable, current pavement data to decide which streets to fix and when. Outdated and inconsistent records, plus manual spot checks, made it hard to build a defensible paving plan or set accurate budgets, leading to uncertainty and delays. Staff were forced to play defense to resident complaints—constantly asked “Why not my road?”—without clear, objective evidence to explain priorities.
Solution
City leadership chose Cyvl to rapidly survey all public streets using LiDAR and advanced sensors, capturing pavement condition and street-level assets in days. Cyvl’s Infrastructure Intelligence platform used AI to convert this data into detailed condition scores, prioritized repair lists, and ready-made reports that leaders could use immediately to plan and communicate. Alongside pavement analytics for 25 miles, the city received a full, geospatial inventory of 6,930 assets—including 2,191 signs, 751 sidewalk segments, 924 street lights, and 517 utility poles—enabling targeted safety and accessibility upgrades residents will see on the ground.
Impact
Within weeks, Bethany Beach received a complete, defensible picture of roadway conditions and assets—on time by June 16, 2025—so crews could move from assessment to action without waiting months. The city used the condition scores and repair recommendations to schedule near-term fixes and plan multi-year investments, improving safety and reducing disruption for residents and visitors. With trustworthy, consistent data, leaders now explain priorities clearly, defend budgets with confidence, and respond faster to community needs.
- Faster pothole and surface repairs, so residents experience smoother, safer trips to work, school, and the beach
- Noticeable drop in 311 complaints as crews address the most urgent segments first and communicate timelines with clear data
- Town meetings run smoother because every street segment has a score, treatment recommendation, and rationale
- More efficient use of taxpayer dollars by aligning budgets to real conditions and eliminating guesswork
- Work scheduling and contractor coordination are faster, with clear scopes and quantities pulled directly from the platform
- Safety upgrades prioritized using the mapped 2,191 signs, 751 sidewalk segments, and 924 street lights, improving walkability and visibility at night
- A comprehensive, defensible paving plan built in weeks instead of months accelerates visible improvements before peak seasons


-%20logo%20(unpadded).png.png)