Ayer, MA
In weeks—not months—Ayer received a complete street-condition baseline and citywide sign inventory, enabling a faster shift from planning to doing.
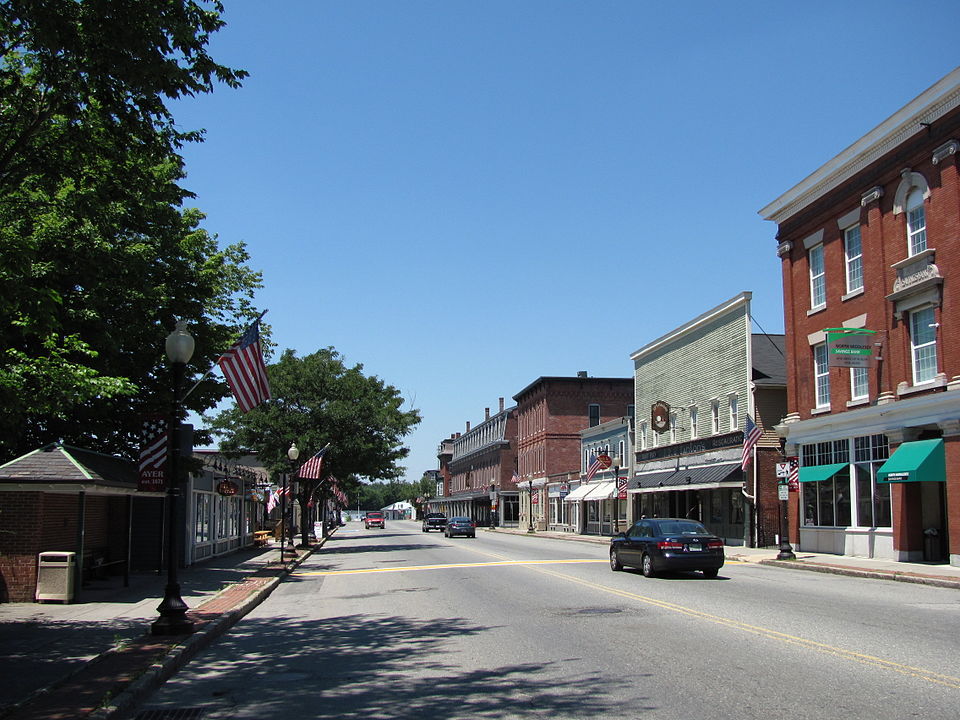
Ayer, MA Infrastructure Assessment
Summary
- Weeks-not-months delivery on November 4, 2024, turned fresh roadway data into faster projects residents can see and feel
- 38 roadway miles scanned and 1,254 signs inventoried, creating a complete, defensible foundation for paving, safety, and budgeting
- Clear, data-backed plans reduced 311 complaints and made town meetings smoother with transparent what-gets-done-and-when timelines
Problem
Ayer’s public works team was operating with outdated and inconsistent roadway data, leaving staff unsure which streets to fix and when and making it hard to forecast accurate paving budgets. At town meetings, leaders were frequently asked “Why not my road?”, and without a defensible prioritization method the team appeared political and stayed on the defensive amid rising 311 emails and calls. Without a complete, current asset inventory and condition assessment, institutional knowledge was hard to transfer and decisions lagged, slowing relief for residents.
Solution
The Town of Ayer chose Cyvl to modernize its street data by using vehicle-mounted LiDAR and sensors to rapidly survey the city’s network, scanning 38 miles and capturing high-definition imagery while inventorying 1,254 traffic signs. Through Cyvl’s Infrastructure Intelligence platform, AI converted these raw datasets into detailed, actionable pavement condition data with block-level condition scores, deterioration insights, prioritized repair and preservation lists, and ready-to-share reports. Delivered on November 4, 2024, the results gave city leaders a defensible, up-to-date foundation to build capital plans, schedule crews, and communicate decisions with confidence and speed.
Impact
In weeks—not months—Ayer received a complete street-condition baseline and citywide sign inventory, enabling a faster shift from planning to doing. With 38 miles documented and scored, staff sequenced near-term fixes alongside long-term preservation, aligning budgets and schedules to deliver visible results sooner for residents. The data-backed story calmed town-hall pressure, made budget requests easier to defend, and focused crews on the highest-benefit projects, accelerating safety and ride quality improvements.
- 38 roadway miles scanned and analyzed with LiDAR and HD imagery, translated into street-by-street condition scores that guide faster repairs residents can feel
- 1,254 signs inventoried to support safer crossings and compliance upgrades near schools, downtown, and high-traffic corridors
- Weeks-to-delivery by November 4, 2024, reduced the time between data collection and project implementation, so fixes hit the street sooner
- Transparent maps, reports, and plan options reduced “Why not my road?” questions and cut 311 volume as residents saw what was scheduled and why
- Defensible, data-driven budgets helped leaders show efficient use of taxpayer dollars and secure timely approvals for paving and maintenance work
- Clear priorities and work windows let crews schedule materials and contractors earlier, reducing change orders and interruptions to daily travel


-%20logo%20(unpadded).png.png)