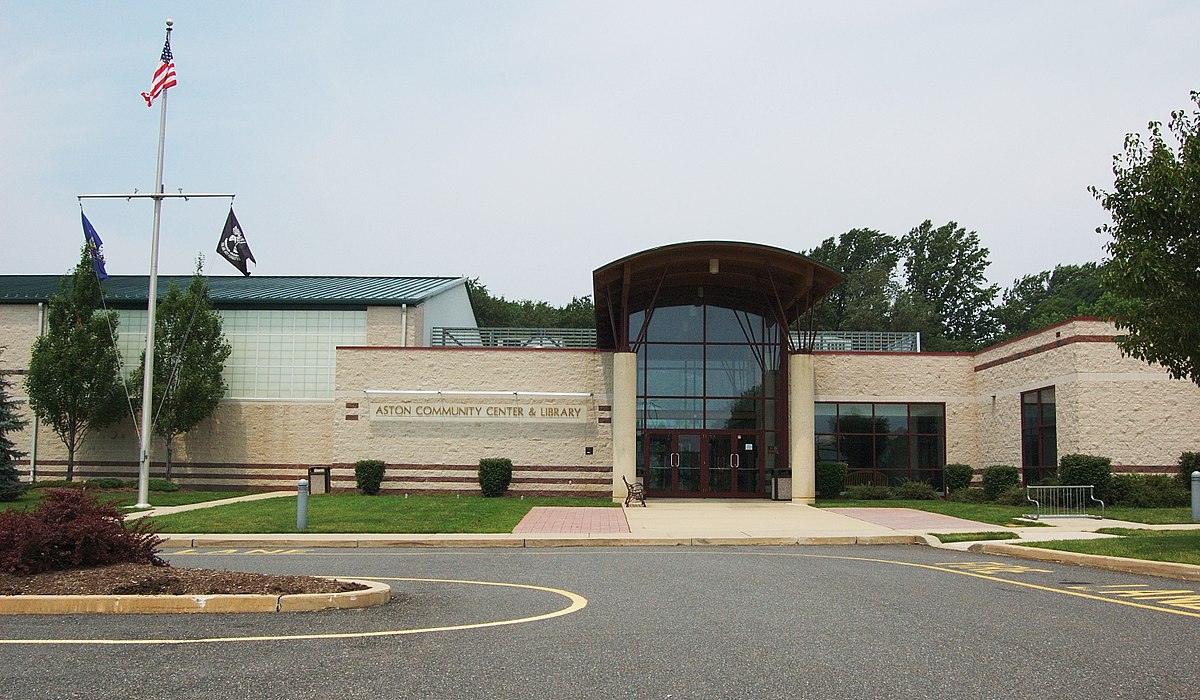
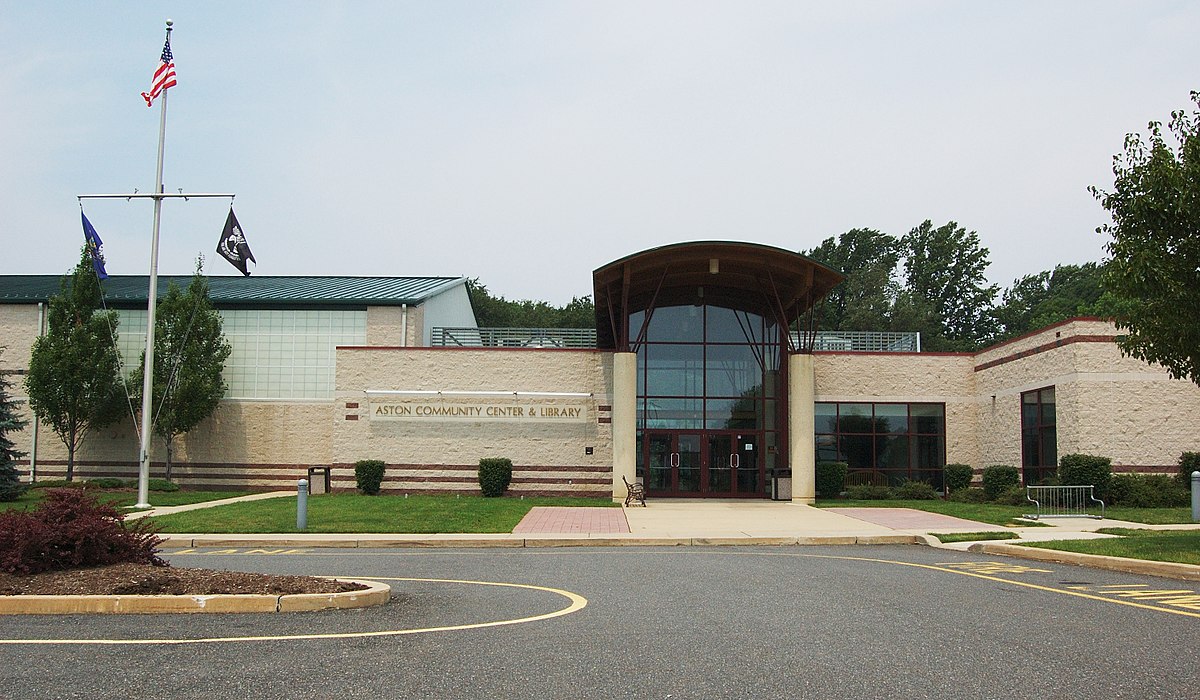
Aston, PA
Armed with current, defensible data, Aston shifted from firefighting to proactive programming in weeks, shrinking the time from assessment to construction scheduling.

Aston, PA Infrastructure Assessment
Summary
- Aston received a complete streets and assets dataset by February, 14, 2025, enabling faster, visible repairs for residents
- 54 roadway miles assessed with LiDAR and AI produced defensible plans that improve safety and travel for drivers, cyclists, and school buses
- 3,651 signs inventoried and 1,253 catch basins mapped to target safety upgrades and drainage fixes where residents feel it most
Problem
Aston’s road network experiences heavy wear from freeze–thaw cycles and commuter traffic, but staff were working from outdated and inconsistent pavement information that made year-to-year planning uncertain. Without a reliable, current baseline, the team didn’t know which roads to fix or when, making it hard to build accurate paving budgets or sequence maintenance work. At town meetings, residents often asked “Why not my road?”, and without clear, objective evidence, leaders struggled to justify decisions and moved reactively to complaints instead of proactively scheduling work.
Solution
Aston chose Cyvl to rapidly survey the township using vehicle‑mounted LiDAR and sensors, with data and deliverables ready by February, 14, 2025. Through Cyvl’s Infrastructure Intelligence platform, AI transformed the raw scans into detailed, actionable pavement condition data for all 54 roadway miles, including condition scores, prioritized repair lists, and transparent reports leaders can share. In the same effort, the team inventoried 3,651 signs and mapped 1,253 catch basins, creating a unified, defensible asset inventory that ties maintenance choices directly to resident safety, mobility, and drainage performance.
Impact
Armed with current, defensible data, Aston shifted from firefighting to proactive programming in weeks, shrinking the time from assessment to construction scheduling. Departments now coordinate from a single source of truth, making budget requests, grant applications, and crew assignments faster and easier to explain to council and residents. Most importantly, residents benefit from quicker fixes, safer intersections, and drainage work that reduces flooding and pothole formation.
- 54 roadway miles scored and mapped so the city can deliver a clear, transparent multi‑year plan residents can track
- 3,651 signs inventoried to target safety upgrades in school zones and busy corridors, improving compliance and visibility
- 1,253 catch basins mapped to guide cleaning and repair cycles that reduce nuisance flooding and protect pavement life
- Final data and reports delivered by February, 14, 2025—weeks instead of months—so spring paving, patching, and crack sealing can start sooner
- Objective condition scores and maps reduce 311 complaints and make council meetings smoother by showing why projects are prioritized
- Data‑backed budget requests are easier to defend, improving the odds of funding approval for high‑impact corridors and neighborhood streets
- Budget allocation, public communication, and work scheduling are now straightforward because every decision is grounded in trusted data


-%20logo%20(unpadded).png.png)