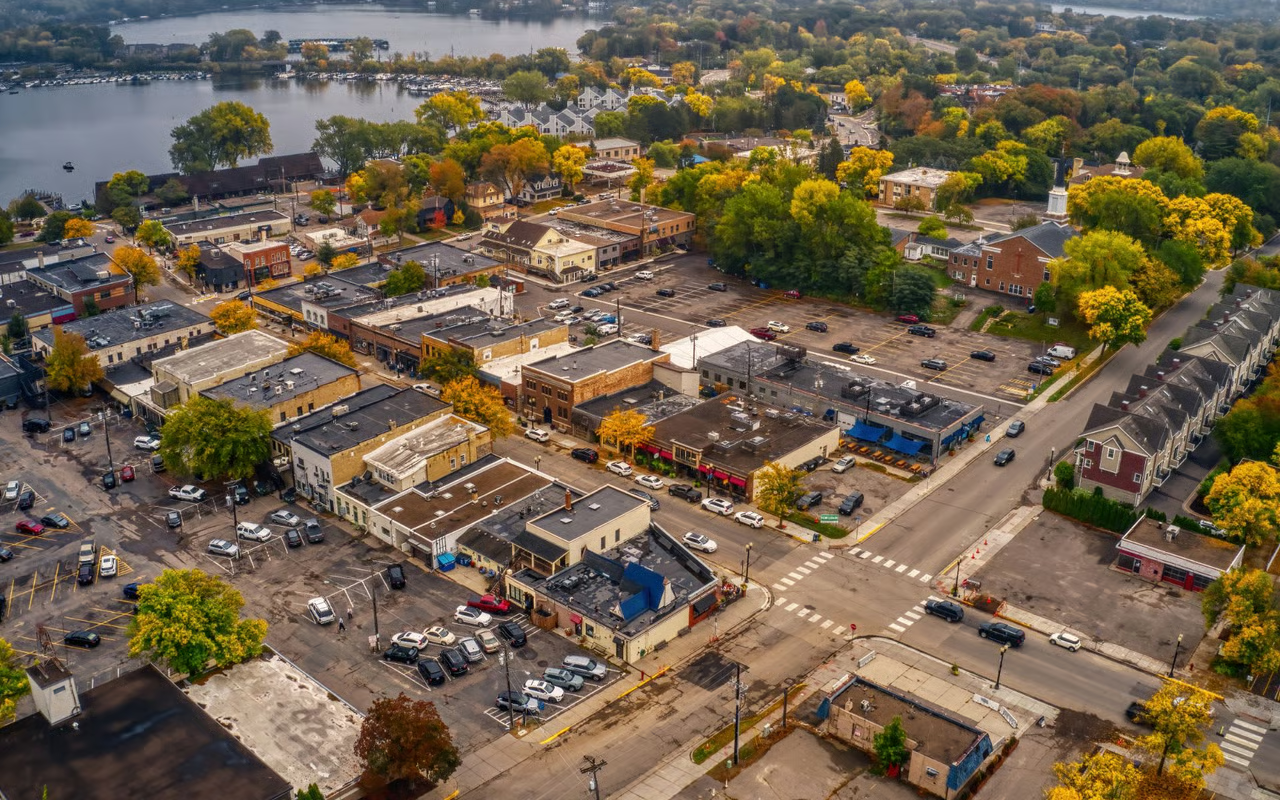
Apple Valley, MN
Within weeks, Apple Valley moved from guesswork to a data-driven pavement program that residents could see and feel on their streets.

Apple Valley, MN Infrastructure Assessment
Summary
- 80 roadway miles scanned and analyzed in weeks, enabling faster street fixes for residents this construction season
- Detailed, segment-level pavement condition data delivered July 10, 2024, to guide defensible plans and budgets
- Clear maps and reports improved council communication and reduced 311 pressure by showing what gets fixed and when
Problem
Apple Valley’s freeze–thaw cycles and steady suburban growth were accelerating pavement wear on neighborhood streets and key arterials. Without current, consistent data, the team didn’t know which roads to fix or when and struggled to present accurate, defensible paving budgets, pulling them into reactive decisions. At town meetings, staff were constantly asked “Why not my road?” and lacked a clear, unbiased prioritization method to justify choices across the entire network.
Solution
Apple Valley chose Cyvl to rapidly survey the full network using vehicle-mounted LiDAR and sensors, capturing precise measurements across 80 roadway miles. Cyvl’s Infrastructure Intelligence platform used AI to transform raw measurements into segment-level condition scores, prioritized repair and preservation lists, and communication-ready maps and reports the city could stand behind. Delivered by July 10, 2024, the city received defensible plans and budget scenarios they could act on immediately to accelerate work for residents.
Impact
Within weeks, Apple Valley moved from guesswork to a data-driven pavement program that residents could see and feel on their streets. The city re-sequenced summer work to address the most critical segments sooner, tightened cost estimates, and scheduled crews with confidence. With clear evidence in hand, council discussions ran smoother, resident questions were easier to answer, and fixes reached the street faster.
- 80 roadway miles surveyed with LiDAR and sensors in weeks, not months, so improvements started sooner for residents
- Condition scores, maps, and a prioritized repair list delivered by July 10, 2024, enabling immediate scheduling and contractor coordination
- Safer travel for drivers, cyclists, and buses as crews target high-severity segments and implement preventative maintenance faster
- Fewer 311 complaints because residents can see the plan, the timeline, and the reasons behind each project
- Budget allocation is now transparent and defensible, showing efficient use of taxpayer dollars across the entire network
- Field crews no longer walk roads to assess conditions, improving safety and freeing staff time for higher-value work
- Town meetings run more smoothly as staff answer “why this road now” with unbiased data and clear visualizations


-%20logo%20(unpadded).png.png)