Smarter Collaboration, Clearer Insights: Map sharing, map notes, and quick statistics now available
Municipal teams need fast, clear information to keep projects moving and stakeholders aligned. Our latest platform update focuses on exactly that — giving you easier ways to share insights, understand system-wide conditions, and document what’s happening on the ground.
This release centers on one major theme: give teams clearer information, in less time, with fewer steps. Three new features—map sharing, map notes, and layer aggregates—are out now.
🗺️ Map Sharing: Portable Cyvl maps with AI-generated insights
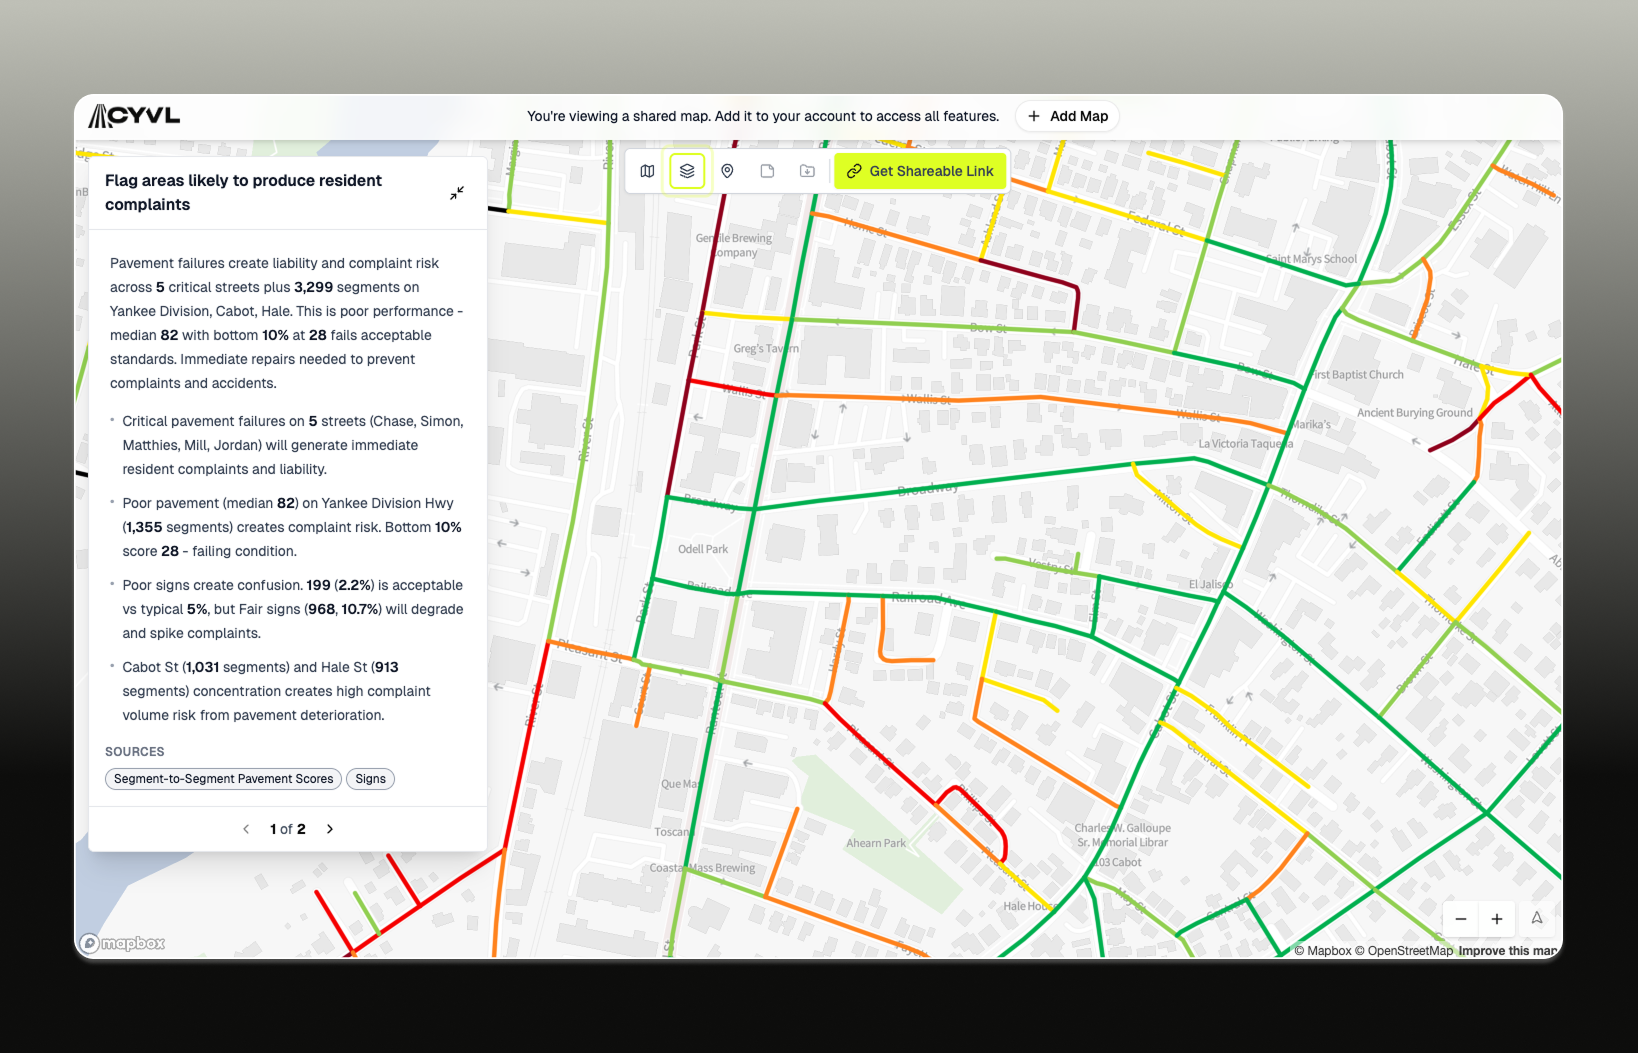
Our new Map Sharing tool makes it simple to communicate what’s happening across your network.
You can now:
- Select a set of layers
- Generate an AI-powered executive summary of key insights
- Share it all through a view-only URL
No exporting screenshots or drafting summaries — the platform automatically highlights trends like pavement condition, asset counts, and priority areas. Recipients can explore the shared layers without needing a login.
For municipal staff, this is especially impactful. You can send a clear, self-contained update before a meeting, give leadership a quick way to understand what’s happening on the network, or share a focused view with a contractor without exposing your entire dataset.
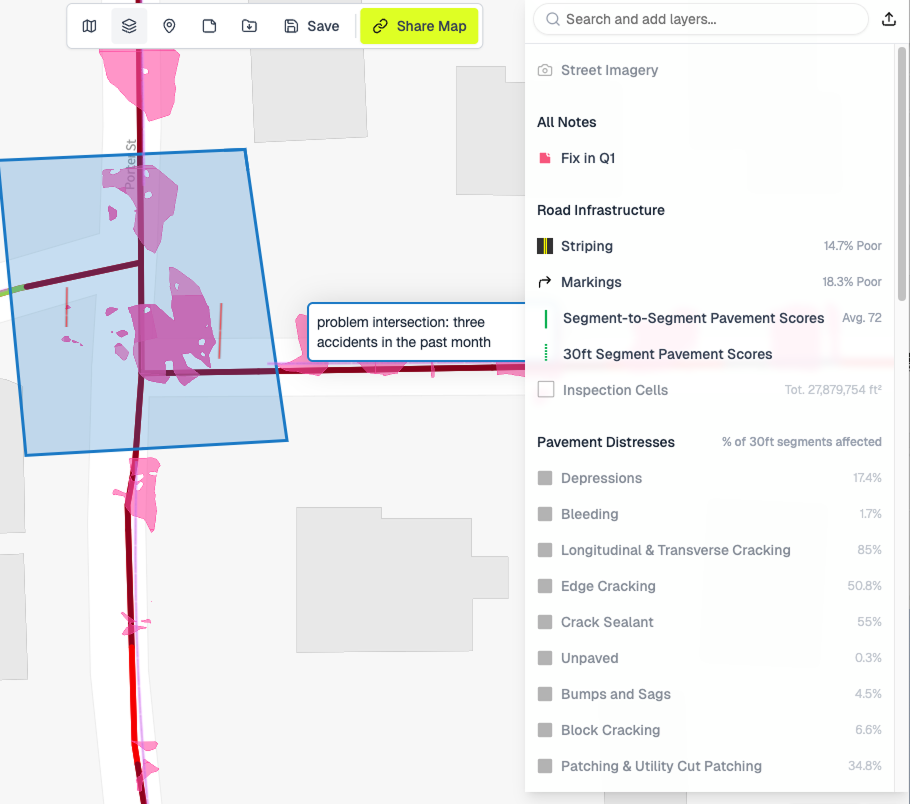
📝 Notes: Document what you see, when you see it
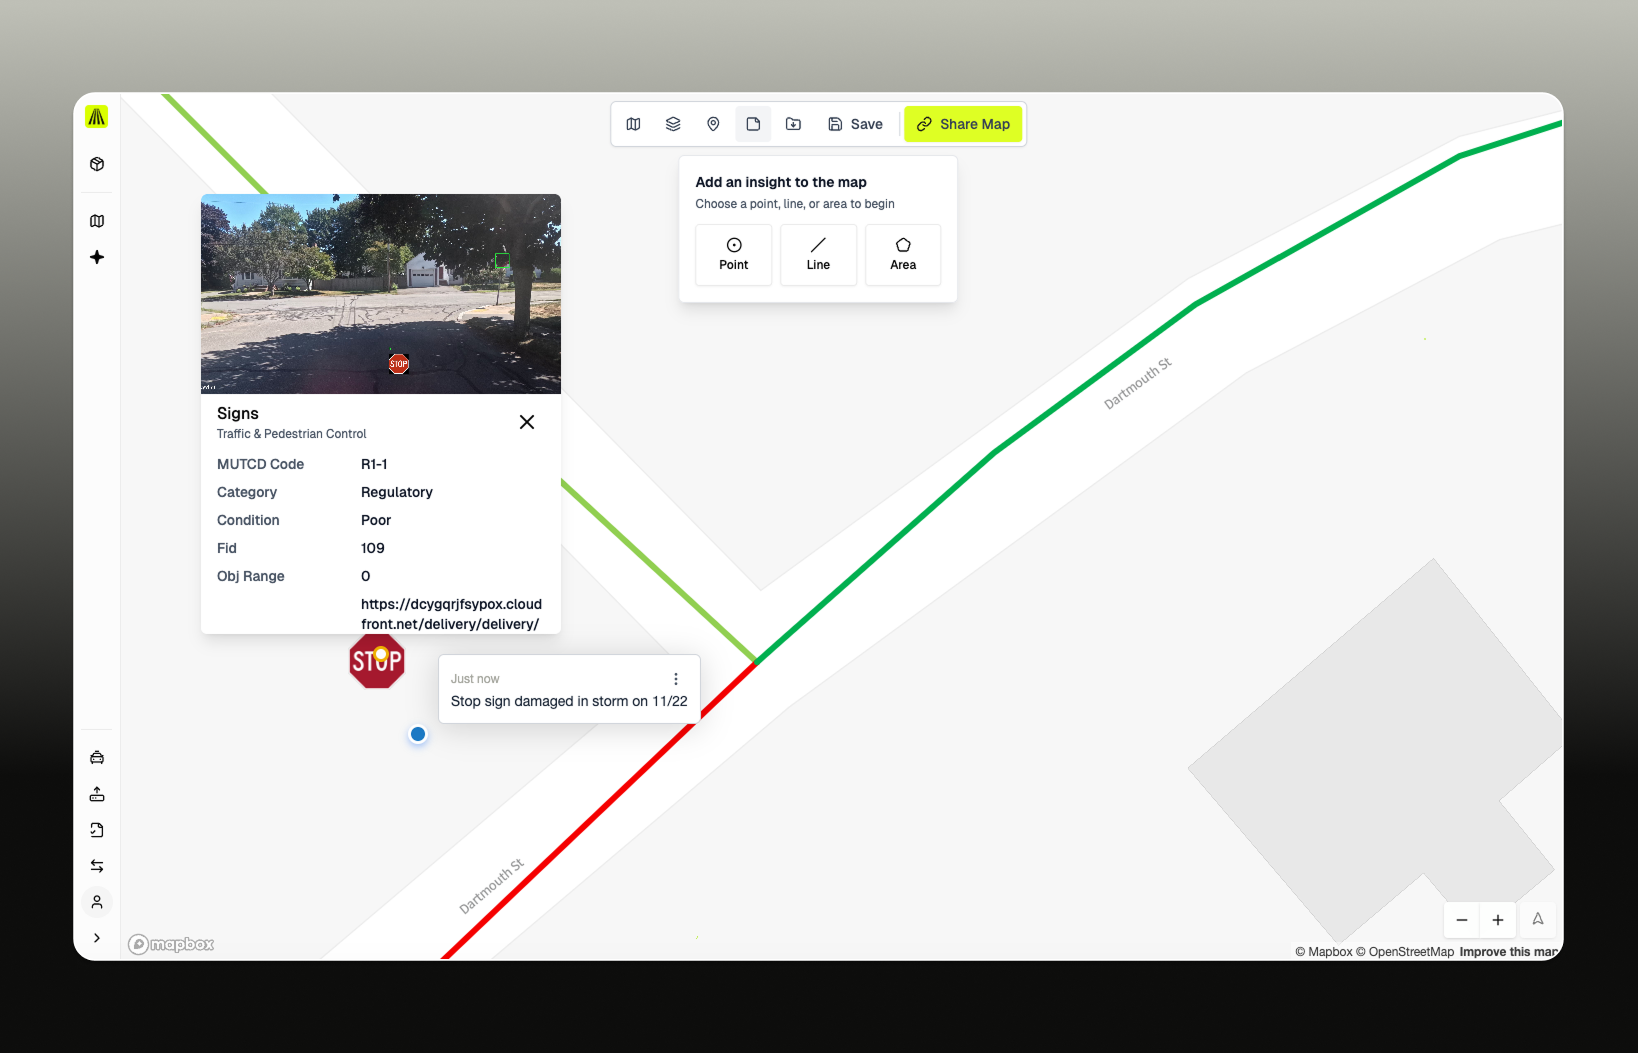
Operational knowledge is critical — and often lives inside staff conversations or personal notebooks. Our new Notes feature lets you document that context directly on the map.
You can now attach notes to a:
- Point (e.g., a sign that needs replacement)
- Line (e.g., a segment of road awaiting a utility project)
- Area (e.g., a neighborhood where drainage issues have been reported)
Notes live alongside your other layers, so the next time someone opens that asset group, the “why” behind your data is as visible as the data itself.
📊 Layer Aggregates: Quick system-wide metrics
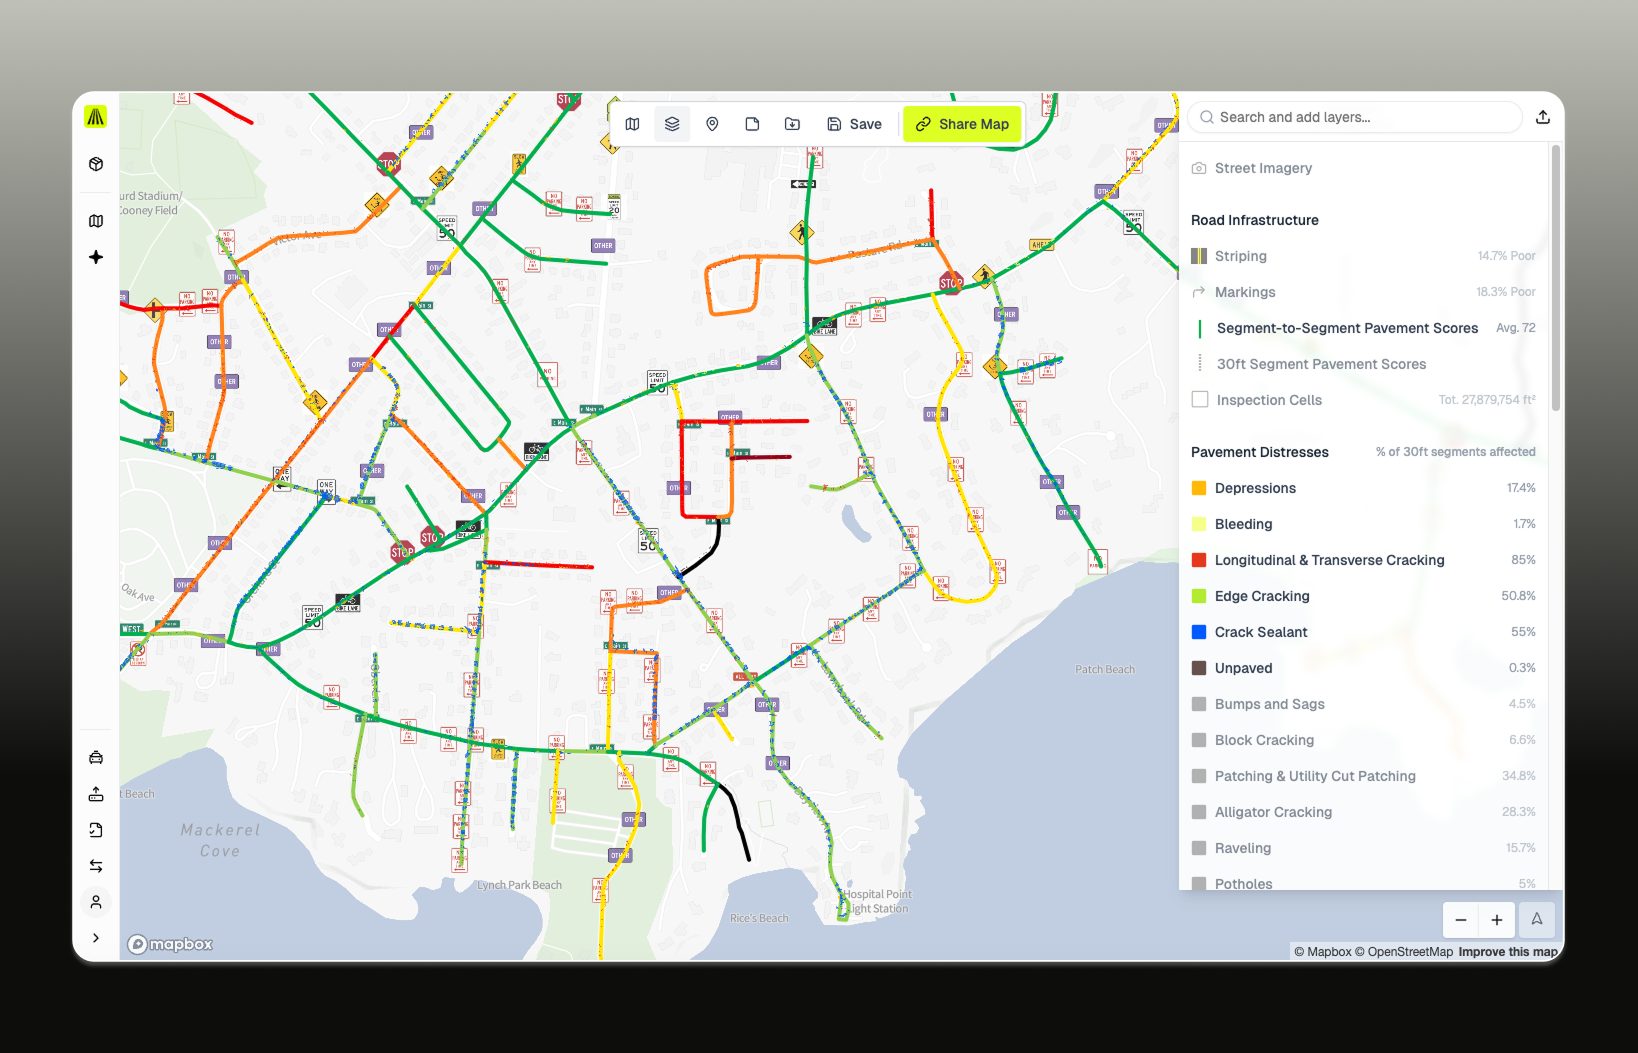
Municipal teams rarely have the time to click through thousands of assets to understand what’s going on. That’s why we introduced Layer Aggregates, a new way to get high-level metrics directly within the Layers panel. Each asset category now displays high-level metrics such as:
- Network score (e.g., 72)
- Asset totals (e.g., 1,049 hydrants)
- Condition indicators (e.g., 5% of 30-ft segments have potholes)
These quick statistics give you situational awareness without needing to run a report or filter the map. They’re designed for the realities of municipal work: responding to a question in a meeting, preparing talking points, or confirming system-wide health before setting priorities.
See the platform in action!
These updates make Cyvl faster, clearer, and more collaborative — helping municipal teams move from data to decisions with less friction.
👉 Want a walkthrough of the new features? Request a demo and we’ll show you what’s new.
Easy steps to create a color palette
Lorem ipsum dolor sit amet, consectetur adipiscing elit lobortis arcu enim urna adipiscing praesent velit viverra sit semper lorem eu cursus vel hendrerit elementum morbi curabitur etiam nibh justo, lorem aliquet donec sed sit mi dignissim at ante massa mattis.
- Neque sodales ut etiam sit amet nisl purus non tellus orci ac auctor
- Adipiscing elit ut aliquam purus sit amet viverra suspendisse potent
- Mauris commodo quis imperdiet massa tincidunt nunc pulvinar
- Excepteur sint occaecat cupidatat non proident sunt in culpa qui officia
What is a color palette?
Vitae congue eu consequat ac felis placerat vestibulum lectus mauris ultrices cursus sit amet dictum sit amet justo donec enim diam porttitor lacus luctus accumsan tortor posuere praesent tristique magna sit amet purus gravida quis blandit turpis.

Don’t overspend on growth marketing without good retention rates
At risus viverra adipiscing at in tellus integer feugiat nisl pretium fusce id velit ut tortor sagittis orci a scelerisque purus semper eget at lectus urna duis convallis porta nibh venenatis cras sed felis eget neque laoreet suspendisse interdum consectetur libero id faucibus nisl donec pretium vulputate sapien nec sagittis aliquam nunc lobortis mattis aliquam faucibus purus in.
- Neque sodales ut etiam sit amet nisl purus non tellus orci ac auctor
- Adipiscing elit ut aliquam purus sit amet viverra suspendisse potenti
- Mauris commodo quis imperdiet massa tincidunt nunc pulvinar
- Adipiscing elit ut aliquam purus sit amet viverra suspendisse potenti
What’s the ideal customer retention rate?
Nisi quis eleifend quam adipiscing vitae aliquet bibendum enim facilisis gravida neque euismod in pellentesque massa placerat volutpat lacus laoreet non curabitur gravida odio aenean sed adipiscing diam donec adipiscing tristique risus amet est placerat in egestas erat.
“Lorem ipsum dolor sit amet consectetur adipiscing elit, sed do eiusmod tempor incididunt ut labore et dolore magna aliqua enim ad minim veniam.”
Next steps to increase your customer retention
Eget lorem dolor sed viverra ipsum nunc aliquet bibendum felis donec et odio pellentesque diam volutpat commodo sed egestas aliquam sem fringilla ut morbi tincidunt augue interdum velit euismod eu tincidunt tortor aliquam nulla facilisi aenean sed adipiscing diam donec adipiscing ut lectus arcu bibendum at varius vel pharetra nibh venenatis cras sed felis eget.


-%20logo%20(unpadded).png.png)